The North American Dividend Growth ETF Portfolio (Canadian Investor Edition)
Last Updated:

It wasn’t always cheap being a dividend growth ETF investor in Canada. For a while, your only real options were the Vanguard U.S. Dividend Appreciation Index ETF (VGG) and the iShares S&P/TSX Canadian Dividend Aristocrats Index ETF (CDZ).
These ETFs had management expense ratios (MERs) of 0.30% and 0.66%, respectively—pretty steep if you’re aiming to keep costs low. If you wanted a cheaper option on the U.S. side, you’d have to bite the bullet and convert CAD to USD, which, at today’s exchange rate, is not exactly painless.
Fortunately, Hamilton ETFs recently launched two funds that have neatly solved this problem: the Hamilton CHAMPIONS™ U.S. Dividend Index ETF (SMVP) and the Hamilton CHAMPIONS™ Canadian Dividend Index ETF (CMVP).
Combining these two ETFs can provide exposure to North America’s top dividend growers. And for a limited time, you get the bonus of a 0% management fee. Here’s how they work.
SMVP: U.S. Dividend Champions
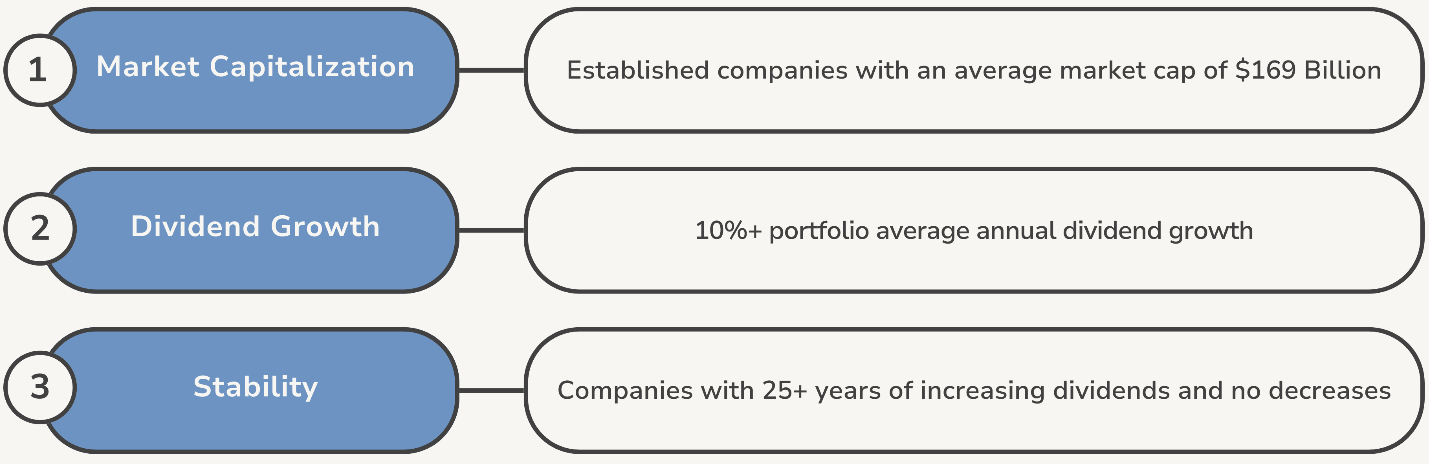
SMVP tracks Solactive United States Dividend Elite Champions Index, which focuses on U.S. companies that have increased their dividends for at least 25 consecutive years without a single cut.
This stringent screening process results in a portfolio with an average annual portfolio dividend growth rate of around 10% and a natural tilt toward large-cap stocks.
Compared to the broader S&P 500, this index offers a more defensive blue-chip portfolio. It emphasizes sectors like consumer staples, industrials, and healthcare, avoiding the heavy tech exposure you typically find in other large-cap U.S. indices.

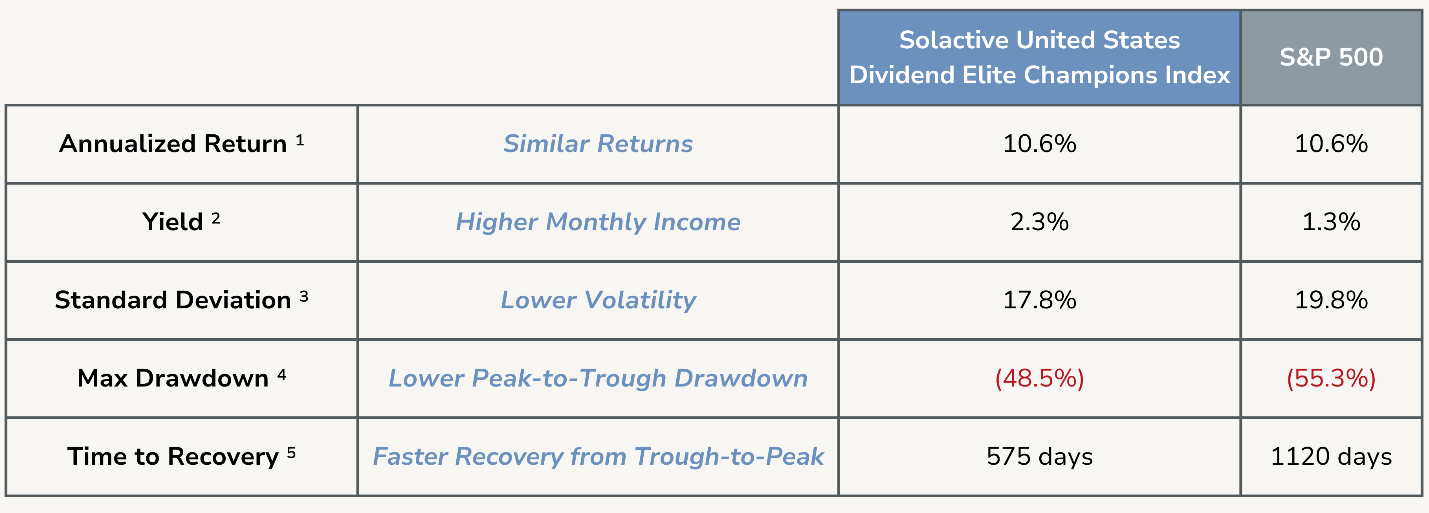
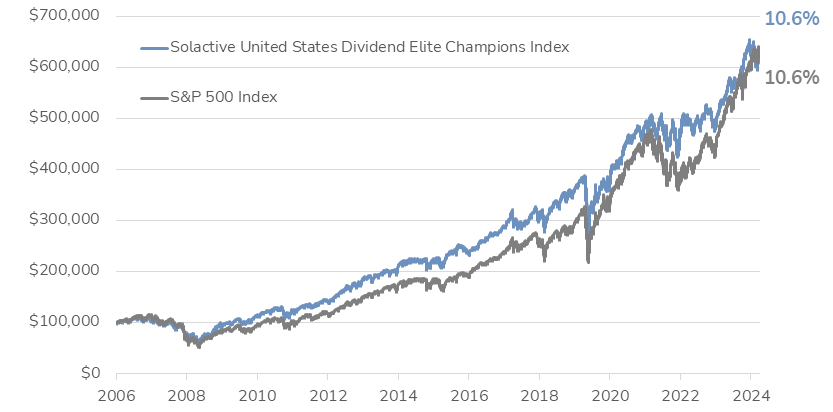
If you’re like me and prioritize risk management, this index hits the mark. Historically, it has delivered returns similar to the S&P 500 but with lower volatility, shorter drawdowns, and shallower losses during market downturns—all while offering a higher dividend yield.
SMVP tracks this index and currently features a 0% management fee through January 31, 2026, after which it will still remain competitive at 0.19%, making it cheaper than VGG. If you're worried about a falling U.S. dollar eroding your returns, SMVP also offers currency hedging, ensuring your performance mirrors the underlying index and not the fluctuations in the exchange rate.
CMVP: Canadian Dividend Champions
The domestic counterpart to SMVP is CMVP, which passively tracks the Solactive Canada Dividend Elite Champions Index.
The methodology is similar to SMVP, but since the Canadian market is smaller, this index only requires companies to have increased dividends for at least 6 consecutive years with no decreases.
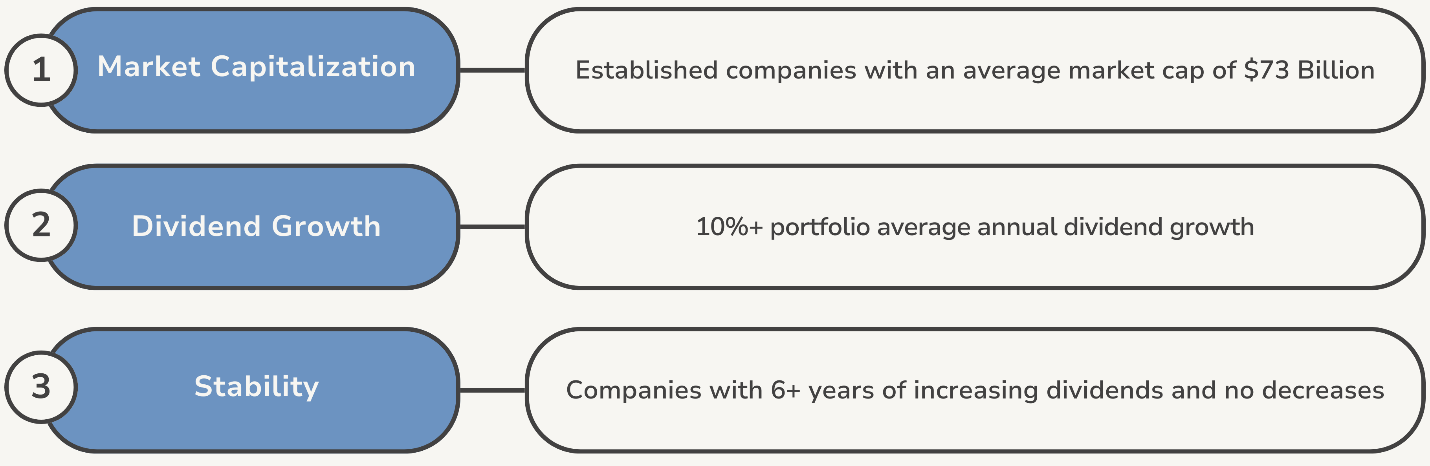
Despite the shorter dividend growth history, the portfolio still has a large-cap tilt with an average annual portfolio dividend growth rate of 10%.
The sector exposure of CMVP is quite close to the S&P/TSX 60, which is to be expected given the narrower scope of the Canadian market. You'll find the usual overweights to financials and energy, with the typical blue-chip suspects like banks, pipelines, and railways well represented.
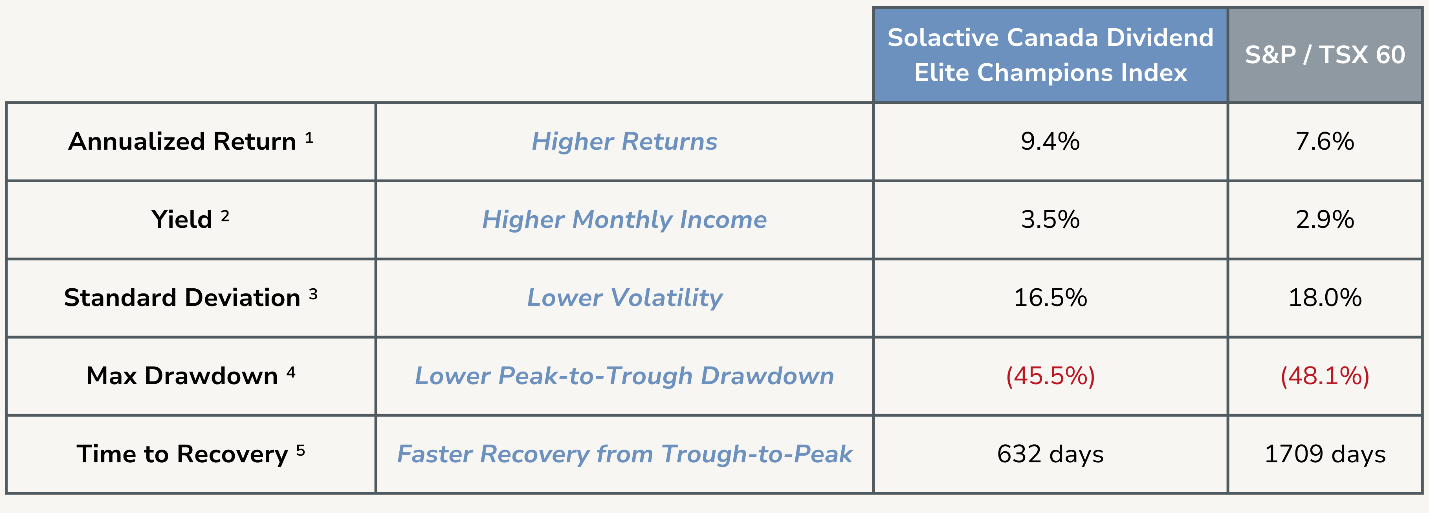
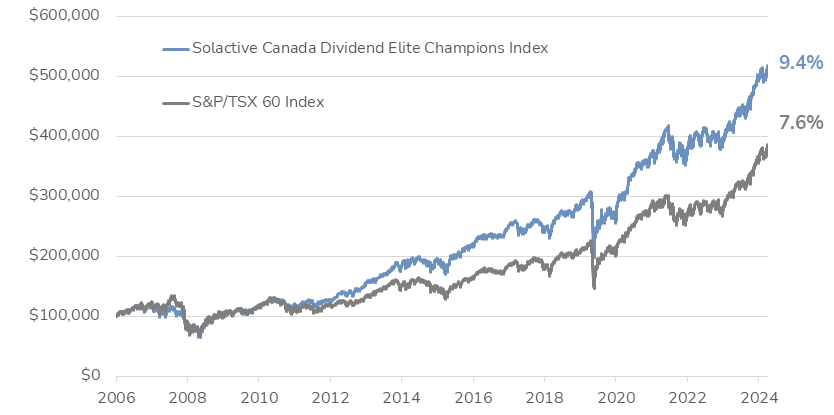
Like its U.S. counterpart, the Solactive Canada Dividend Elite Champions Index has delivered favorable risk metrics, showing lower volatility and shorter, shallower drawdowns. While it offers an increased yield, what's particularly impressive is that it has outperformed the S&P/TSX 60 on a total return basis.
CMVP also comes with a 0% management fee through January 31, 2026, after which it will revert to 0.19%, which is significantly cheaper than CDZ. There’s no need to worry about currency hedging here since it’s a Canadian ETF holding Canadian stocks.
On top of that, CMVP is very tax-efficient, as it primarily provides eligible Canadian dividends, with no REITs in the mix to spit out ordinary income distributions.
Putting the portfolio together
You can slice and dice this portfolio however you want, but I'm going with an allocation of 70% in SMVP and 30% in CMVP.
Why this split? It mirrors the MSCI World Index, where the U.S. allocation typically hovers around 70%. The remaining 30% is mostly EAFE (Europe, Australasia, and the Far East) markets. Since Hamilton doesn’t yet offer an international version of SMVP and CMVP, we'll fill the gap with Canadian stocks instead.
A 30% home bias overweight isn’t a bad move. It enhances tax efficiency, reduces currency risk, and aligns well with what Vanguard and iShares do in their asset allocation ETFs. It's a pragmatic approach, particularly for Canadian investors looking to balance growth potential with stability and cost efficiency.
