The Two Types of ETFs I Would Never Buy and Hold
Last Updated:

There’s no such thing as a “bad” ETF in isolation, just bad use cases and bad timing. But some ETFs are built on shakier foundations than others, either because of the quality of their underlying assets or the way they’re constructed.
While almost anything can be a good buy at the right price, the types of ETFs you’re about to see have repeatedly shown that buy-and-hold investors often get burned. These aren’t the usual leveraged or inverse ETFs, either. That would be too easy.
As always, this is just my opinion. I’m sure some of you have made great trades with the ETFs I’m about to mention. But if your plan is to buy them and forget about them, my advice is simple: be careful, and buyer beware.
Mortgage REIT ETFs
Mortgage REITs may carry the “REIT” label, but they’re not your typical real estate plays. Unlike equity REITs that own physical properties, these funds invest in mortgage-backed securities (MBS), both agency and non-agency.
In practice, they behave more like high-yield bond funds with a leverage twist than traditional real estate vehicles. What they really are is a giant spread trade on steroids. Mortgage REITs borrow short and invest long, aiming to profit from the difference in yields, known as the net interest margin.
But that structure makes them extremely sensitive to interest rates, and not in a good way. Rising rates or a flattening yield curve can crush their margins. Add leverage and you have a recipe for extreme volatility and steep drawdowns.
From August 17, 2011, to July 25, 2025, thw two largest mortgage REITs by AUM delivered textbook lessons in what that poor risk adjusted returns looks like.
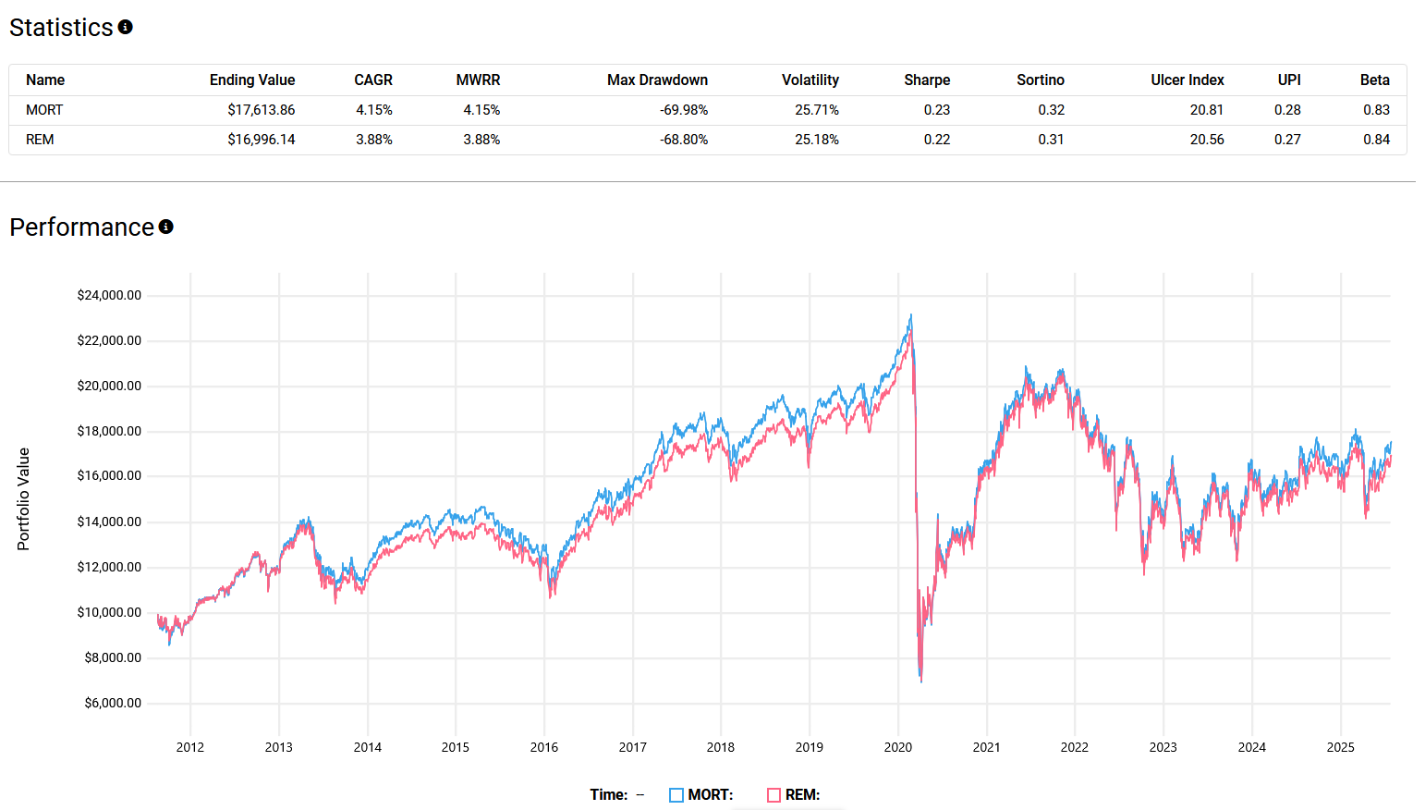
In the total return chart, the ride looks rocky but manageable. Volatility was high at 25%, drawdowns hit nearly 70%, and Sharpe ratios were just above 0.20, well below what you’d want for a long-term core holding.
But the real story shows up in the second chart. If you withdrew the distributions from these ETFs for income (instead of reinvesting them), you ended up steadily losing capital.
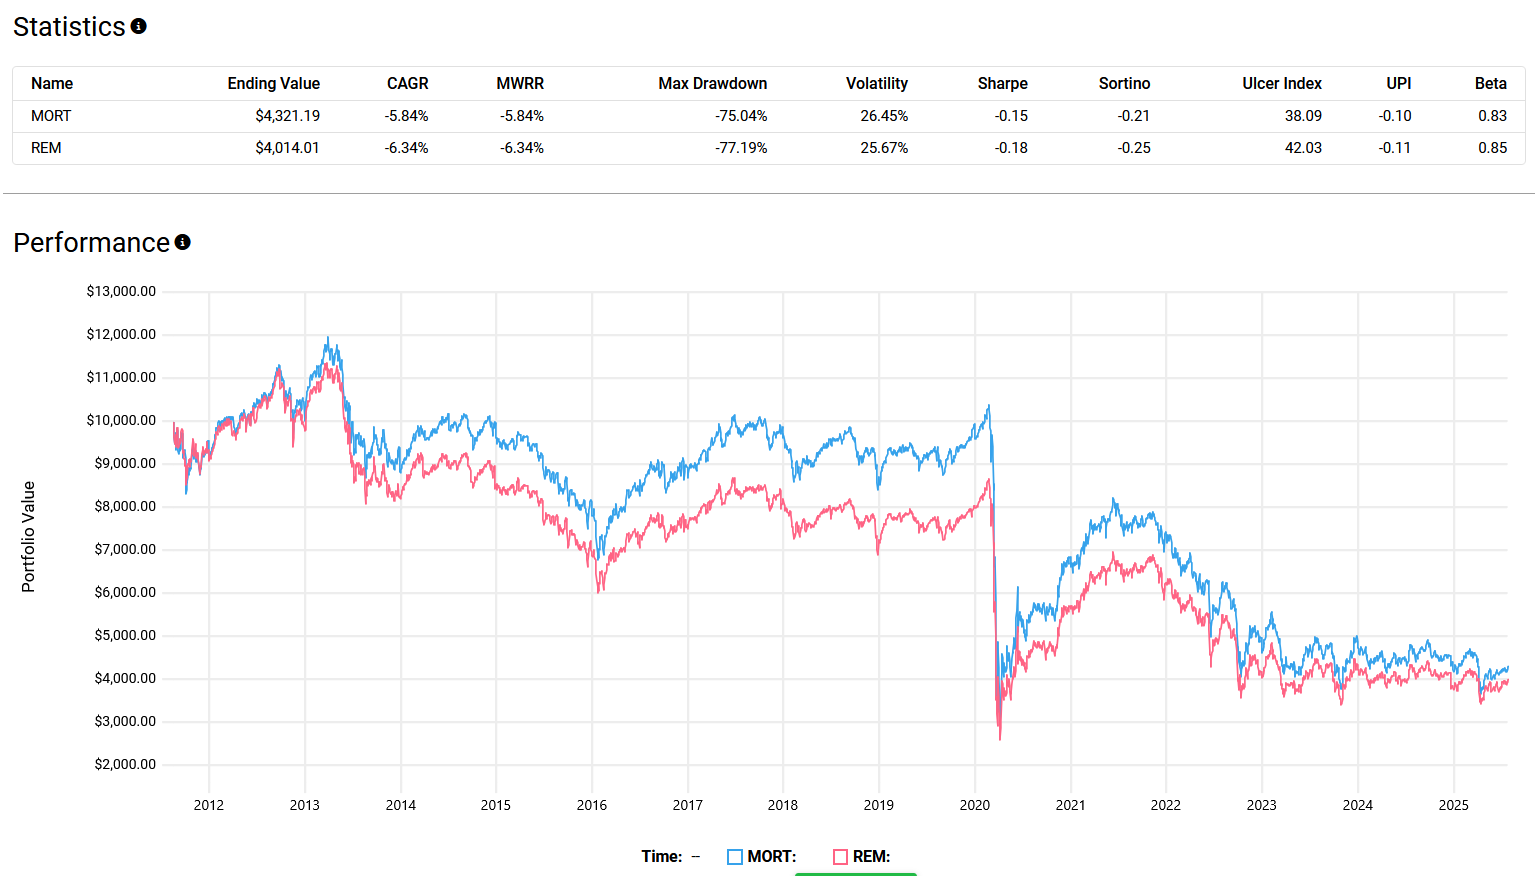
Over the same period, the price-only return dropped to a compounded loss of over 5% annually, with both ETFs giving up more than 75% of their value from peak to trough at various points.
That juicy 12 percent yield? Illusory. Total return is what matters, and in that department, mortgage REIT ETFs have historically disappointed buy-and-hold investors.
To be fair, there are scenarios where these ETFs shine. They can deliver explosive upside during periods of stable or falling interest rates, especially if spreads are wide.
But timing has to be near perfect. Historically, most investors have ended up on the wrong side of the trade, more often ripped apart than rewarded.
Cannabis ETFs
I smoke a ton of pot. I love the chronic. But I would never, ever invest in a marijuana stock again. My first big loss came in 2018 at the peak of the Canadian legalization hype, and I’ve watched the sector bleed ever since. The U.S. cannabis industry remains structurally broken.
Chronic unprofitability (pun fully intended), constant dilution, toxic convertible debt deals, and a chaotic patchwork of state-by-state legalization have made it nearly impossible for most companies to scale efficiently or generate consistent cash flow.
Add to that the fact that cannabis remains federally illegal in the U.S., and what you have is an environment that’s hostile to capital and brutal on shareholders. Ironically, the exact scenario that led to consolidation and scale in the tobacco industry (the regulatory clampdown) is what has prevented the same from happening in cannabis.
Instead of large, well-capitalized players buying up smaller operators and cutting costs, cannabis remains fragmented, overregulated, and underbanked. The result has been years of declining stock prices and zero pricing power.
Just look at the numbers. From mid-2022 to mid-2025, all three prominent cannabis ETFs (TOKE, MSOS, and WEED) have been absolute disasters.
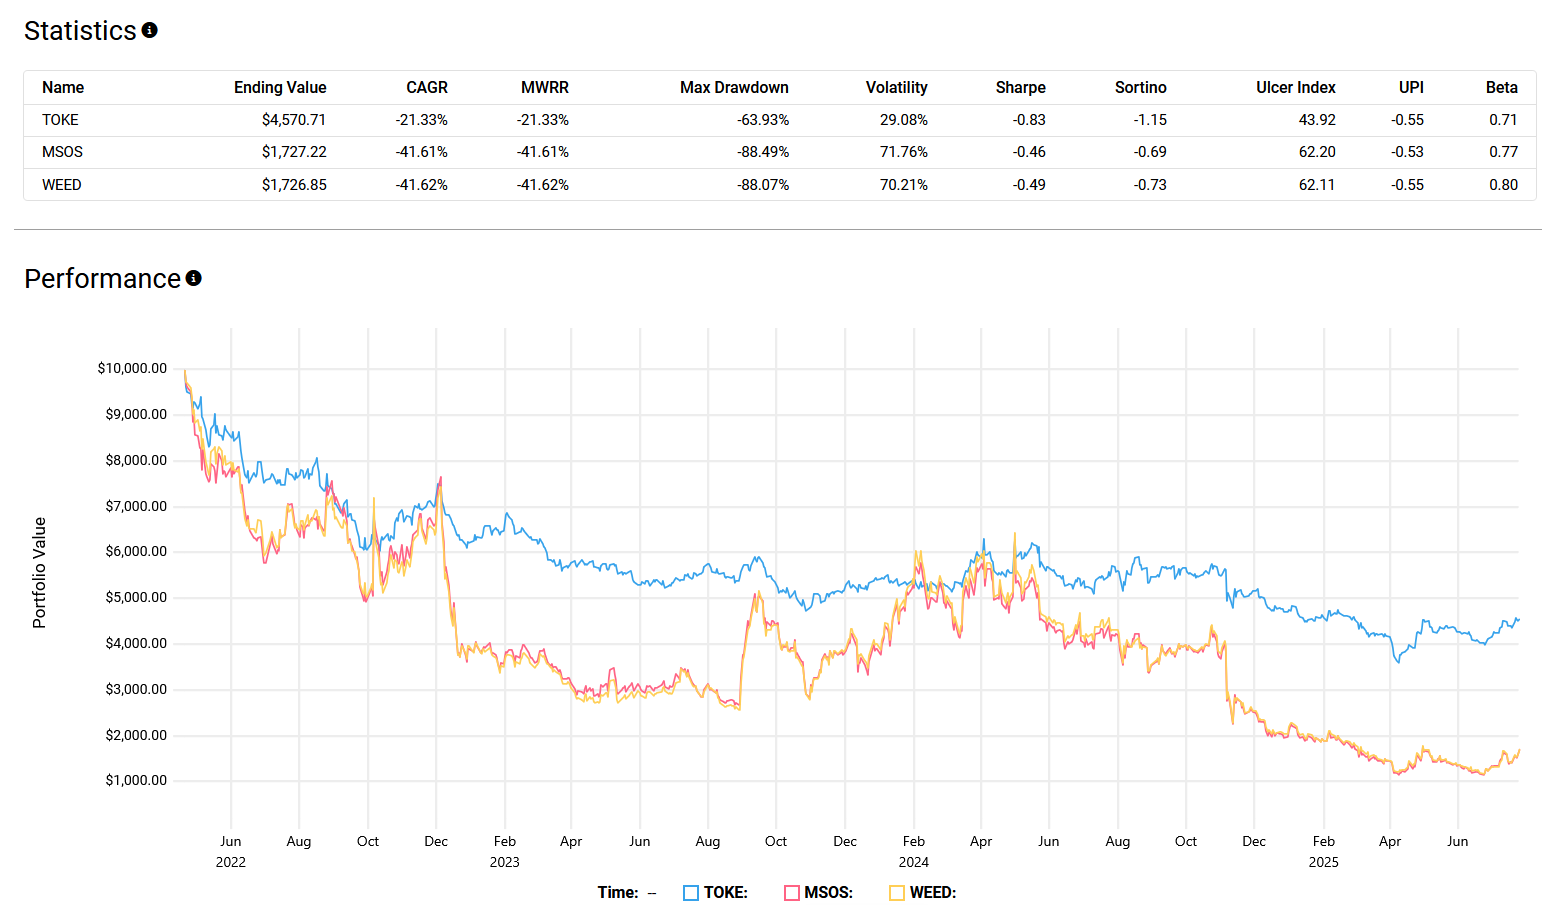
MSOS and WEED are down more than 80%, and TOKE, while less volatile, still posted an annualized loss of over 21%. Sharpe and Sortino ratios are deeply negative. Volatility is sky-high, especially for MSOS and WEED, both sitting around 70%. And the Ulcer Index, which measures how painful the drawdowns are, is among the worst I’ve seen for any ETF not using leverage.
This is not a buy-and-hold story. It’s a textbook example of how a popular theme with strong cultural tailwinds can still destroy investor capital when the business side isn’t there. So yes, light up if you want, but maybe don’t light up your portfolio.
