The Vanguard North America Dividend Yield & Growth ETF Portfolio
Last Updated:

A pet peeve of mine is that, as of October 2025, there still isn’t a single North America–focused dividend ETF that perfectly balances yield, growth, and cost efficiency for Canadian investors.
You can find plenty of options that do one or two of those things well, but not all three. So, until someone decides to give us a proper all-in-one solution, I’m going with a simple two-ETF approach—available in Canadian dollars.
This mix combines one high-yield ETF and one dividend growth ETF to cover both sides of the income spectrum, without straying from Vanguard’s trademark low-fee philosophy.
Vanguard U.S. Dividend Appreciation Index ETF (VGG)
Half of the portfolio is allocated to VGG, which wraps the U.S.-listed Vanguard Dividend Appreciation ETF (VIG) in a Canadian structure, coming in at a 0.31% management expense ratio.
The underlying benchmark, the S&P U.S. Dividend Growers Index, is one of the more disciplined dividend growth methodologies out there.
It requires companies to have at least ten consecutive years of dividend increases, filters out the top 25% of highest-yielding names to sidestep yield traps, caps individual holdings at 4%, and excludes REITs entirely. The result is a cleaner portfolio tilted toward quality and consistency.
VGG’s trailing 12-month yield is 1.23%, which might look modest compared to high-yield ETFs, but the focus here is total return, not income. On that front, it delivers—VGG has produced a 13.39% annualized return over the past ten years with dividends reinvested.
That said, there are two caveats. First, distributions are subject to a 15% U.S. withholding tax on dividends, which is unavoidable unless you hold the U.S.-listed VIG version in a Registered Retirement Savings Plan (RRSP).
Second, VGG is unhedged, meaning a stronger U.S. dollar helps, while a rising Canadian dollar hurts. If you’d rather neutralize currency effects, there’s a hedged version available: the Vanguard U.S. Dividend Appreciation Index ETF (CAD-hedged) (VGH).
Vanguard FTSE Canadian High Dividend Yield Index ETF (VDY)
VDY complements VGG perfectly by leaning into the other side of the dividend spectrum—yield and value. While VGG captures steady dividend growers with quality and profitability screens, VDY focuses on high-income payers in the Canadian market.
VDY tracks the FTSE Canada High Dividend Yield Index, which holds 58 large-, mid-, and small-cap stocks that rank in the top half of the market based on forward dividend forecasts.
As of August 31, 2025, the ETF’s portfolio trades at 14.4 times earnings and 1.8 times book value, with a ROE of 11.9% and an earnings growth rate of 13.9%. For comparison, the broader FTSE Canada All Cap Index trades at 19.3 times earnings and 2.3 times book, with an 11.4% ROE and 13.5% earnings growth.
The result is a portfolio that naturally tilts toward value while delivering a healthy trailing 12-month yield of 3.67%, paid monthly. With dividends reinvested, VDY has compounded at an impressive 11.52% annualized over the past decade, outperforming the iShares S&P/TSX 60 Index ETF (XIU), which returned 10.88% over the same period.
At a 0.22% management expense ratio, it’s among the lowest-cost dividend ETFs in Canada. And beyond performance, VDY is also one of the most tax-efficient options available, an advantage if you’ve already maxed your TFSA, RRSP, or FHSA and are investing in a taxable account.
For 2024, VDY distributed $2.45139 per unit in total, with $2.15701 classified as eligible dividends—taxed at the lowest marginal rate for Canadians—and $0.29367 as capital gains, which are only 50% taxable. Just $0.00071 came as return of capital, a minimal amount that simply reduces your adjusted cost base without triggering immediate tax liability.
Putting it together
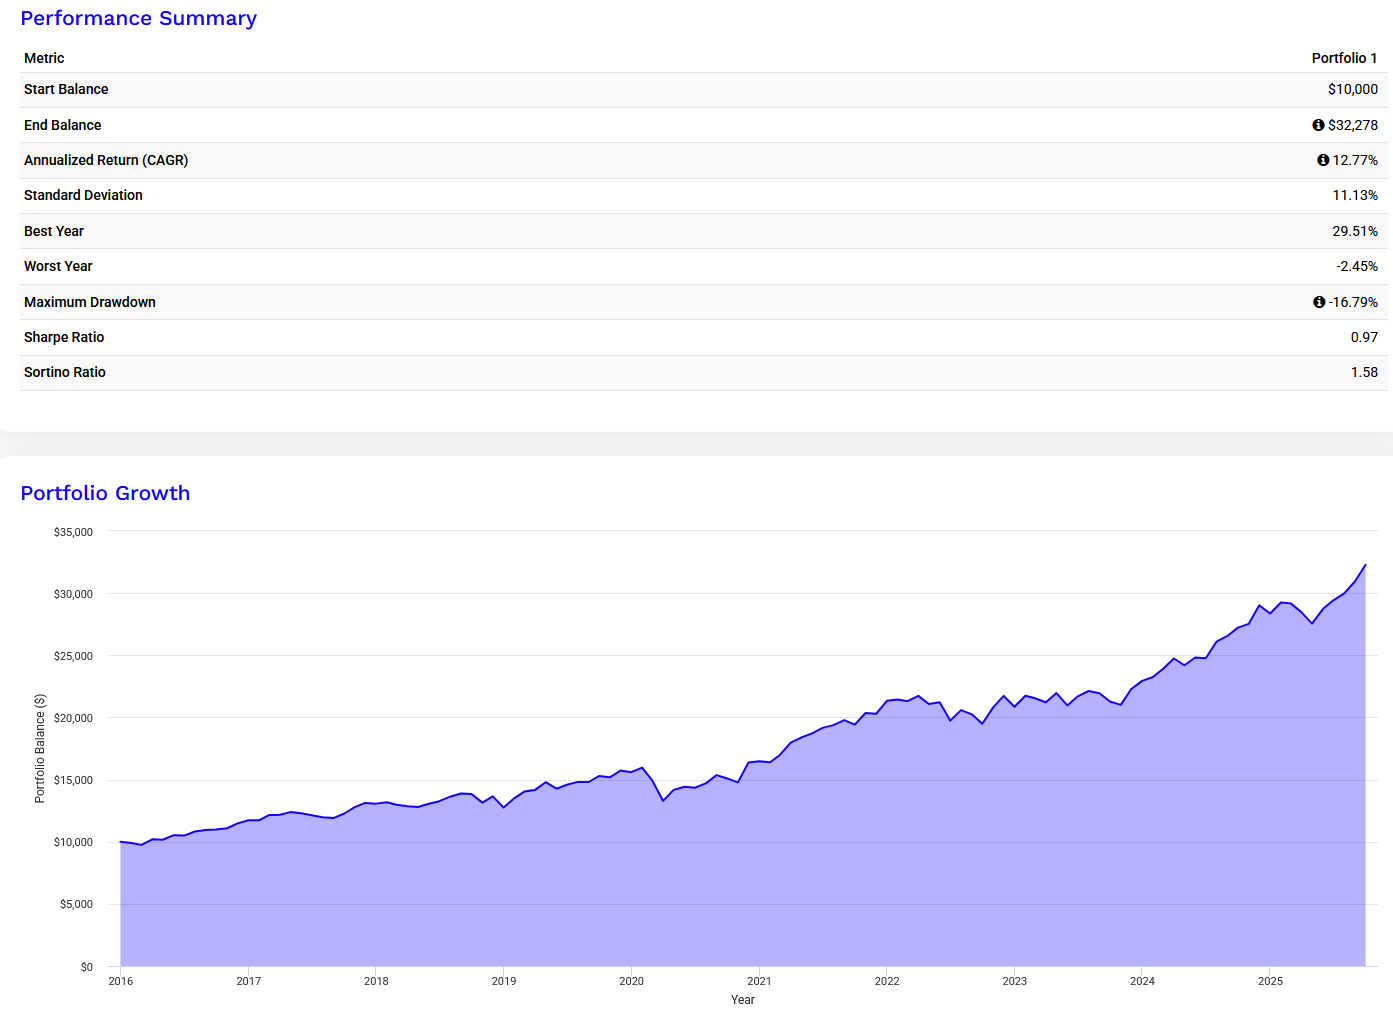
Over the full period shown, a 50/50 allocation to VGG and VDY would have turned $10,000 into roughly $32,278, translating to a 12.77% annualized return (CAGR) with a 11.13% standard deviation.
That’s an attractive risk-adjusted profile, reflected in a Sharpe ratio of 0.97 and a Sortino ratio of 1.58, meaning investors were well-compensated for the level of volatility.
The portfolio’s best year came in at +29.5%, while the worst drawdown was just -16.8%, showing it handled market turbulence well relative to a typical all-equity mix.
Of course, the backtest assumes no transaction costs or tax drag, so real-world results will vary slightly. To keep friction minimal, investors should hold both ETFs in a registered account such as an RRSP or TFSA and use a zero-commission platform like Wealthsimple.
