What Influences Monthly Dividend Size for the JPMorgan Equity Premium Income ETF (JEPI)?
Last Updated:

Earlier in May, I reviewed the JPMorgan Equity Premium Income ETF (JEPI) and had plenty of good things to say about it.
You get top-tier active management from Hamilton Reiner, a relatively modest 0.35% expense ratio, strong risk-adjusted returns, and a generous yield, albeit one that’s not particularly tax efficient.
JEPI recently went ex-dividend on June 6 and paid out $0.54001 per share. That’s one of its highest monthly payouts in recent memory, and if you look at prior years, the fund’s distributions have been steadily increasing.
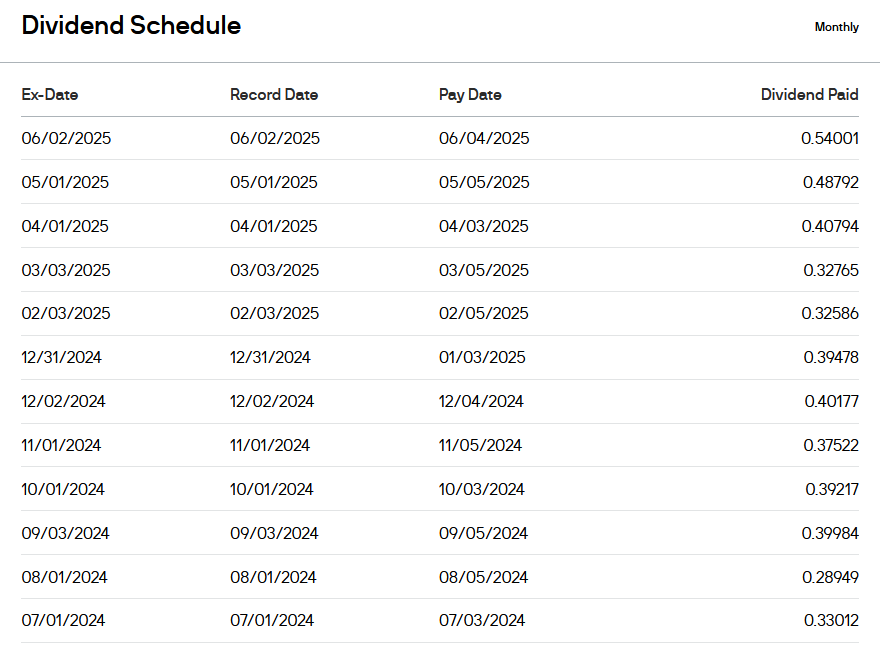
So, what’s behind that rise? Let’s break down what drives JEPI’s monthly income distributions and whether the trend looks sustainable.
How JEPI generates income
Here’s a quick recap if you didn’t catch my previous review: JEPI owns an actively managed portfolio of U.S. large-cap stocks, with a tilt toward lower-volatility and value-oriented names.
On top of that, it runs a covered call overlay to generate income. Specifically, it writes slightly out-of-the-money calls with one-month expiries, staggered weekly for consistent exposure.
But unlike most other covered call ETFs, JEPI doesn’t just sell index options directly. It uses equity-linked notes (ELNs), which are structured contracts, typically issued by large banks. These ELNs are limited to 15% of JEPI’s portfolio and are spread across multiple counterparties to reduce risk.
So, what drives the income you get from JEPI’s ELNs? A big factor is the pricing of the options embedded in those notes. This depends on a few things: how far in or out of the money the option is, how much time is left before it expires, and crucially, market volatility.
When volatility is high, options become more expensive. That’s because there’s more uncertainty, which gives the buyer a greater chance of profiting, so sellers demand a higher premium to take the other side.
The most common measure of this is the CBOE Volatility Index (VIX), which tracks expected volatility in the S&P 500. When the VIX is elevated, JEPI’s ELN payouts tend to increase. This has been the case historically as seen in the chart below.
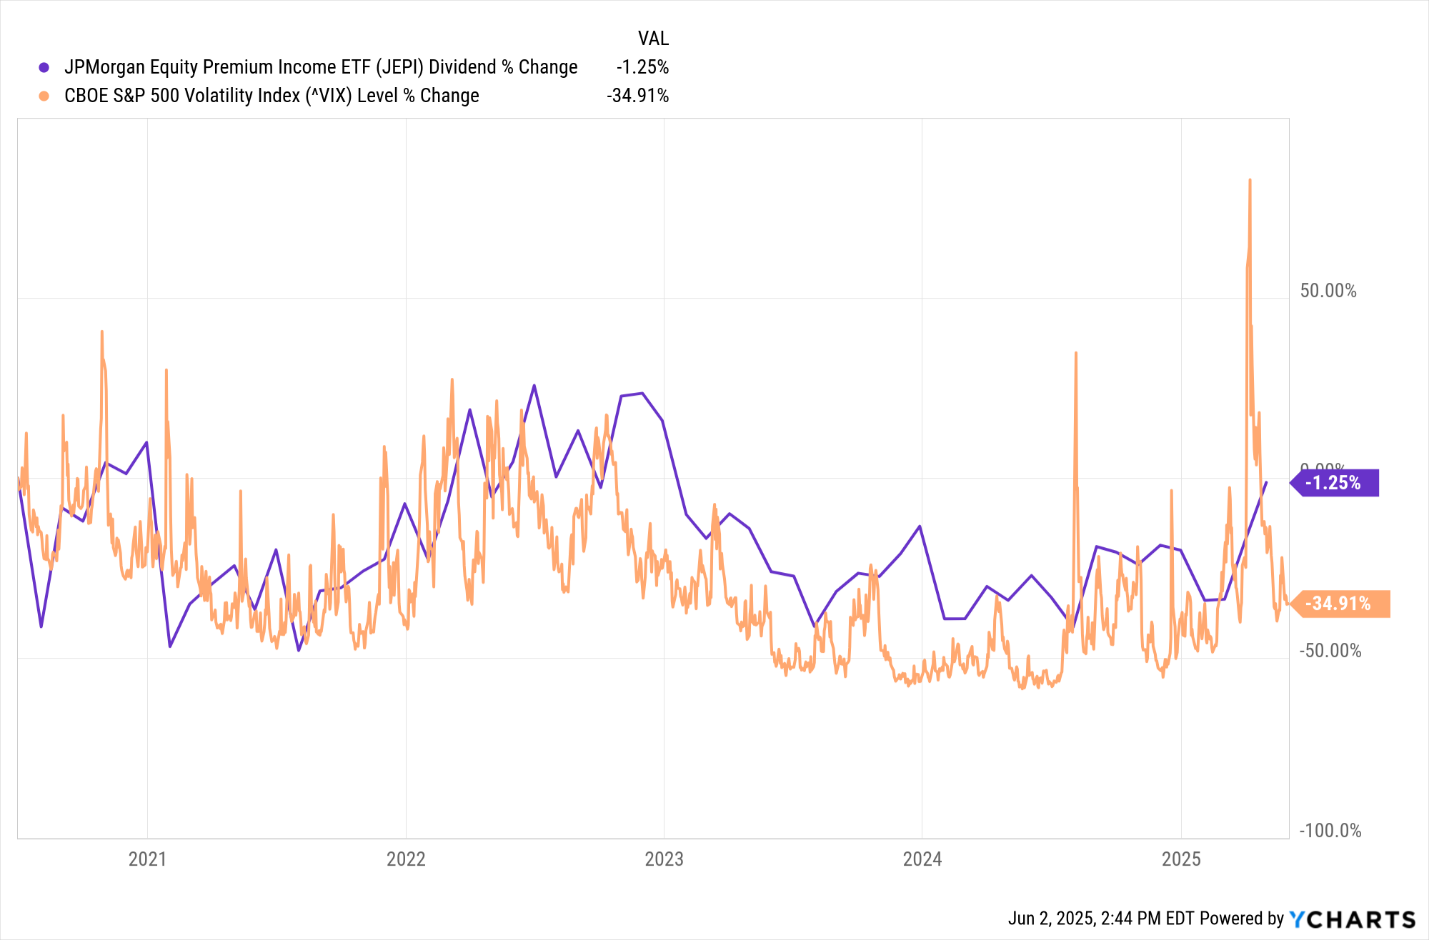
That’s why JEPI is particularly well suited for choppy, high-volatility markets like we’ve seen in 2025. It collects outsized premiums from options without giving up too much upside when stocks move sideways.
Is JEPI’s current yield sustainable?
Not likely, at least not at the current pace. Right now, JEPI is posting a 30-day SEC yield of 11%, well above its historical average in the 7% to 9% range. That’s largely because option premiums from the ELNs have surged alongside market volatility.
But remember: volatility is mean reverting. It tends to spike during market stress but eventually settles back toward historical norms. So, if you’re expecting JEPI to keep delivering a 11% yield like clockwork, you’re probably setting yourself up for disappointment once things cool off.
That said, markets this year haven’t exactly been normal. Trump’s unpredictable trade war rhetoric and on-again-off-again tariff threats (TACO: “Trump Always Chickens Out”) have kept stocks bouncing sideways like a kangaroo.
That’s helped keep the VIX elevated, and in turn, JEPI’s income elevated too. So, while the current yield may hold for now, don’t count on it lasting forever.
