How to Create a Low-Volatility, High-Dividend North American ETF Portfolio
Last Updated:

One of the biggest challenges for ETF investors is lowering portfolio volatility without sacrificing too much long-term return. Fortunately, there are several ways to accomplish that, each with its own advantages and trade-offs.
The most time-tested approach is simply to allocate part of your portfolio to bonds. You have probably heard of the classic 60/40 portfolio, where roughly 60% is invested in stocks and 40% in fixed income. The idea is diversification through correlation, or more precisely, a lack of it.
When stocks decline, central banks often cut interest rates to stimulate the economy, causing bond prices to rise and offset some of the losses. Bonds also tend to be less volatile than equities because bondholders generally rank ahead of shareholders if a company runs into financial trouble.
The problem is that these relationships are not guaranteed. Correlations change over time. Rising inflation can push both stocks and bonds lower simultaneously, exactly what happened during 2022, when aggressive interest rate hikes caused traditional balanced portfolios to lose protection.
Another increasingly popular approach is using derivatives, particularly options. Buffer ETFs, for example, combine puts and calls to define a range of potential outcomes over a one-year period, perhaps protecting against the first 15% of losses while capping gains at 10%.
These strategies certainly have their place, but they also tend to carry higher fees, and many do not generate distributions, leaving investors dependent primarily on price appreciation for their total return.
A third approach is factor investing. Rather than relying on bonds or derivatives, factor strategies intentionally select stocks that have historically exhibited characteristics associated with lower risk. That can mean screening for lower beta, which measures how sensitive a stock has historically been to movements in the broader market.
The same idea applies to generating income. Many investors now turn to leveraged or covered call ETFs in pursuit of higher yields, but those strategies introduce their own trade-offs through higher fees, leverage risk, or capped upside. Sometimes a straightforward dividend-focused strategy built around high-quality companies can accomplish much of the same objective without relying on derivatives at all.
That's the approach we'll take today. By combining four of Fidelity Canada’s factor ETFs, it's possible to build a North American equity portfolio that seeks above-average dividend income while maintaining a lower-volatility profile through systematic factor exposure rather than leverage or options.
50% in Canadian Equities
We'll dedicate half of the portfolio to Canadian stocks. For Canadian investors, maintaining a home-country bias makes a lot of sense. It reduces currency risk because your future spending will likely be in Canadian dollars, and it can also improve tax efficiency through the Canadian dividend tax credit when these ETFs are held in taxable accounts.
The first 25% goes to the Fidelity Canadian Low Volatility ETF (FCCL). This passive ETF tracks the Fidelity Canada Canadian Low Volatility Index. The result is a portfolio of 71 companies with a relatively concentrated top 10, which account for 41.6% of assets.
Compared to the broad Canadian market, FCCL naturally underweights higher-beta sectors such as financials and energy while allocating more toward traditionally defensive industries. Consumer staples represent 11.3% of the portfolio, while industrials account for a healthy 18.9%. The ETF carries a 0.39% management expense ratio.
Complementing FCCL is the Fidelity Canadian High Dividend ETF (FCCD), which also charges a 0.39% management expense ratio and tracks the Fidelity Canada Canadian High Dividend Index. As expected, the portfolio looks quite different.
Energy becomes the largest sector at 22.2%, followed by financials at 26.7%, while utilities receive a meaningful 10.9% allocation. The ETF holds 72 companies and simply focuses on higher-yielding Canadian dividend payers, resulting in a trailing 12-month distribution yield of approximately 3.35%.
50% in U.S. Equities
The remaining half of the portfolio follows the same philosophy in the United States. The first 25% is allocated to the Fidelity U.S. Low Volatility ETF (FCUL). Like its Canadian counterpart, the ETF charges a 0.39% management expense ratio and tracks the Fidelity Canada U.S. Low Volatility Index.
FCUL’s methodology naturally leads to lower allocations to technology and greater exposure to more defensive sectors such as consumer staples, utilities, and industrials. The result is a portfolio designed to reduce overall market sensitivity while maintaining broad exposure to U.S. equities.
The remaining 25% goes to the Fidelity U.S. High Dividend ETF (FCUD). It charges a similar 0.38% management expense ratio and tracks the Fidelity Canada U.S. High Dividend Index.
The portfolio contains 104 companies and emphasizes sectors traditionally associated with higher dividend payouts. Consumer staples represent 15.1% of assets, while both energy and utilities account for roughly 10% each. Financials remain underweight relative to the broad U.S. market. The ETF currently provides a trailing 12-month distribution yield of approximately 2.62%.
How the Portfolio Performed
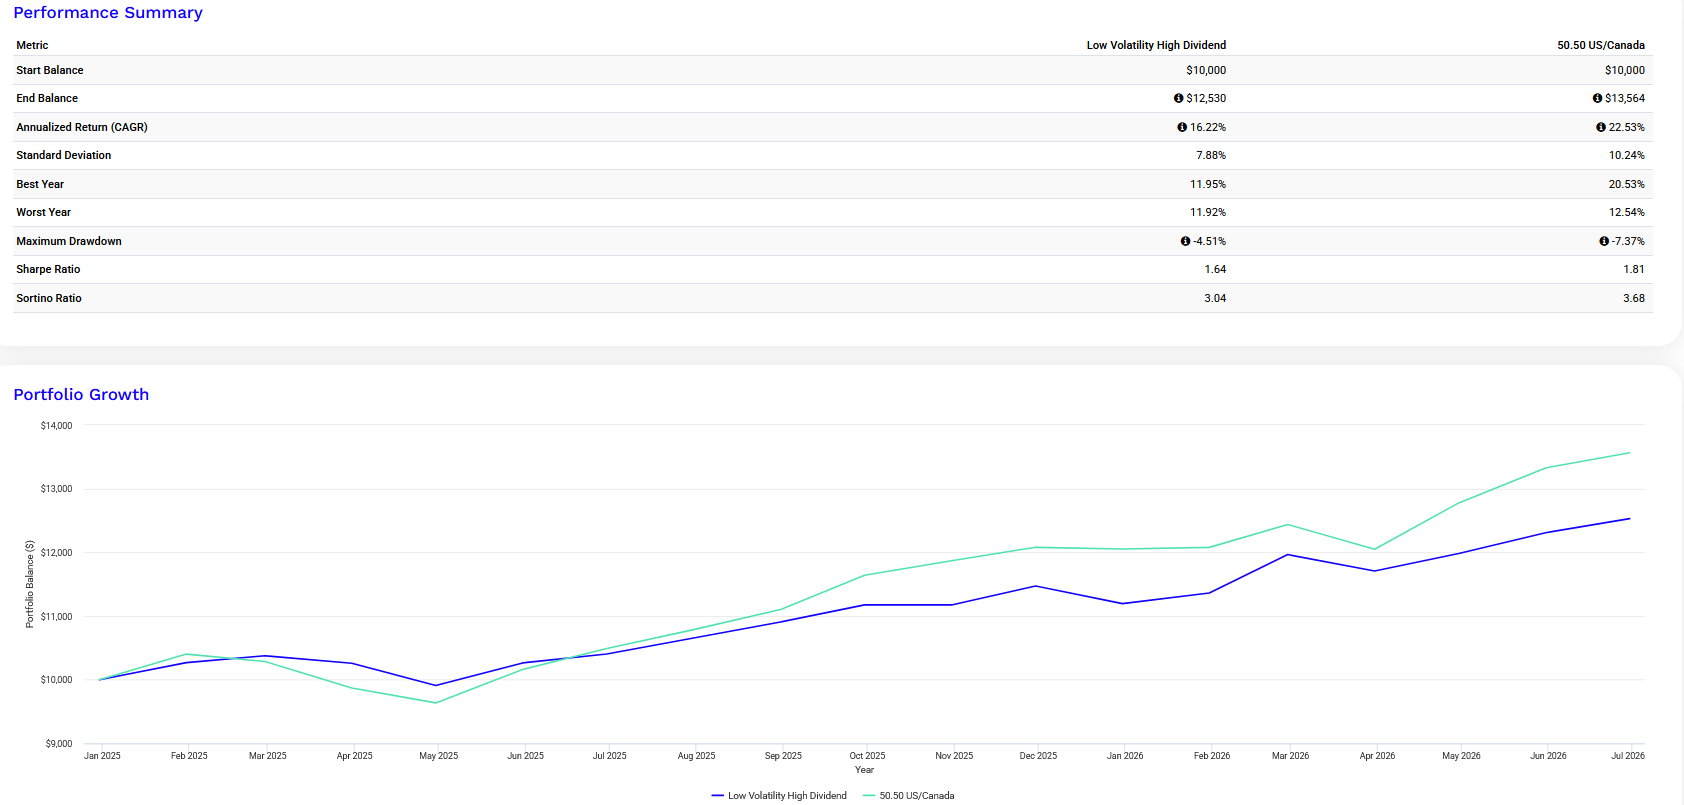
To see how the strategy held up in practice, I backtested the portfolio from January 2025 through June 2026 using annual rebalancing. I compared it against a simple 50/50 combination of the Vanguard S&P 500 Index ETF (VFV) and the iShares S&P/TSX 60 Index ETF (XIU).
Over this period, the Fidelity factor portfolio underperformed not only in terms of annualized total return but also on a risk-adjusted basis, posting a lower Sharpe ratio than the simple market-cap-weighted benchmark.
Source: Portfolio Visualizer
There's an important lesson here: factor investing is not a free lunch. First, the higher management expense ratios create an ongoing headwind compared to broad index ETFs. Second, by emphasizing lower-volatility and higher-dividend stocks, the portfolio naturally sacrifices exposure to many of the high-beta growth companies that have driven market returns in recent years.
That doesn't mean the strategy is flawed. Different factors move in and out of favor over time, and there will inevitably be periods when low-volatility and dividend strategies outperform the broader market. The important question is whether you're willing to stick with the strategy through those cycles.
If you aren't, a simple market-cap-weighted index fund is probably the better choice. If you are, then a systematic factor portfolio like this offers a disciplined way to pursue lower volatility and higher income without relying on leverage or derivatives.