
TD All-Equity ETF Portfolio (TEQT): Is It Better than XEQT and VEQT?
Last Updated:

By assets under management, the iShares Core Equity ETF Portfolio (XEQT) and Vanguard All-Equity ETF Portfolio (VEQT) are two of Canada's most popular 100% equity asset allocation ETFs. XEQT currently has about $22.33 billion in assets under management, while VEQT has approximately $17.02 billion.
The TD All-Equity ETF Portfolio (TEQT) arrived much later and remains a considerably smaller competitor, with approximately $101 million in assets. That's still more than enough scale that fund closure isn't something I'd be particularly concerned about.
By now, virtually every major Canadian bank and ETF provider has responded to the popularity of asset allocation ETFs with its own lineup. The formula is usually familiar: package several underlying ETFs together, maintain predetermined allocations to different markets, automatically rebalance them and offer different versions depending on the desired mix of stocks and fixed income.
I know plenty of investors treat these all-equity versions as essentially interchangeable, and over a sufficiently long investment horizon, they may well prove to be. But there are still some differences under the hood that discerning investors should know about, particularly when it comes to fees and geographic exposure.
Don't get me wrong. I think an investor could do perfectly well dollar-cost averaging into any one of these ETFs inside a registered account and otherwise leaving it alone. But if you're the type who likes examining exactly what you're getting for your money, TEQT does have a few interesting differences from its much larger competitors.
TEQT vs. XEQT and VEQT: Fees
Fees are one area where TEQT has tried to distinguish itself. TD currently lists an ultra-low 0.17% management expense ratio (MER). On a $10,000 investment, that works out to approximately $17 annually in fund expenses, assuming the MER remains unchanged.
The gap with XEQT and VEQT has narrowed considerably, however. Vanguard recently reduced VEQT's management fee from 0.22% to 0.17%. Because the reduction is relatively recent, the fund's new MER won't be known until sufficient expenses have been reported.
As a rough estimate, applying 13% HST to a 0.17% management fee gets you to approximately 0.19%, although the eventual MER can differ because it incorporates other fund expenses as well. BlackRock has made a similar move with XEQT. Its management fee was reduced from 0.18% to 0.17% effective December 18, and its reported MER is currently 0.19%.
That leaves TEQT approximately two basis points cheaper based on the currently reported figures. Put that difference into dollars and it becomes easier to see how little we're talking about. A two-basis-point difference amounts to roughly $2 annually on $10,000, $20 on $100,000 and $200 on $1 million.
Fees matter, particularly when compounded over decades. But at these levels, I don't think a difference of a couple of basis points provides much reason to switch from an existing XEQT or VEQT position, especially if doing so would trigger taxable capital gains.
TEQT vs. XEQT and VEQT: Asset Composition
The more meaningful differences emerge when you look inside the portfolios. For this comparison, I used the ETF comparison tool from TMX.
All three ETFs maintain a substantial Canadian home-country bias. VEQT has the largest target Canadian allocation at approximately 30%, while XEQT and TEQT are closer to 25%. That's considerably more Canada than its share of global equity market capitalization, but home-country bias can have advantages for Canadian investors, including reduced currency exposure and more favourable tax treatment.
Outside Canada, however, the portfolios begin to diverge. TEQT's target allocation is approximately 25% Canadian equities, 55% U.S. equities and 20% developed international equities outside North America. That final allocation provides exposure to developed markets such as Japan, the U.K., France, Switzerland, Germany and Australia.
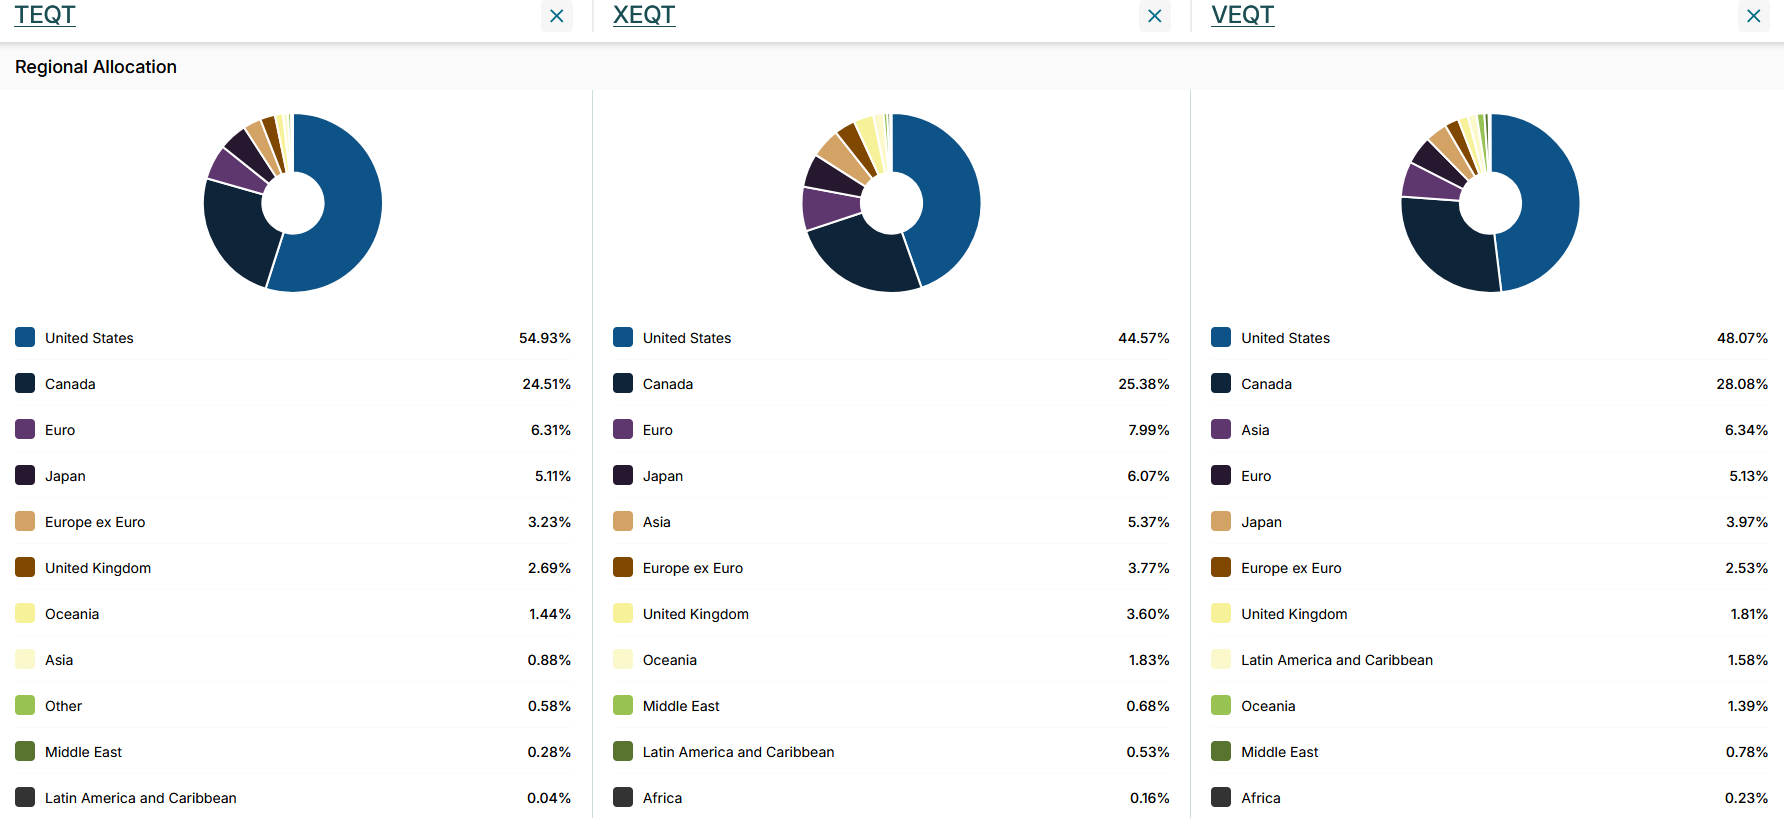
Source: TMX
One conspicuous omission is emerging markets. XEQT maintains a relatively modest emerging-market allocation, while VEQT has a larger one. TEQT has none at all. Whether that's a disadvantage depends on what you want from the portfolio.
Emerging markets provide additional geographic diversification and exposure to economies such as China, India, Taiwan and Brazil. They can also introduce additional political, regulatory, governance and currency risks, while their diversification benefits haven't always translated into superior returns. Some investors are perfectly comfortable leaving them out.
TEQT consequently has greater exposure to developed North American markets, particularly the U.S. That also helps explain some of the small differences visible in the sector allocations. TEQT is somewhat more technology-heavy, while the three portfolios otherwise maintain broadly similar sector profiles.
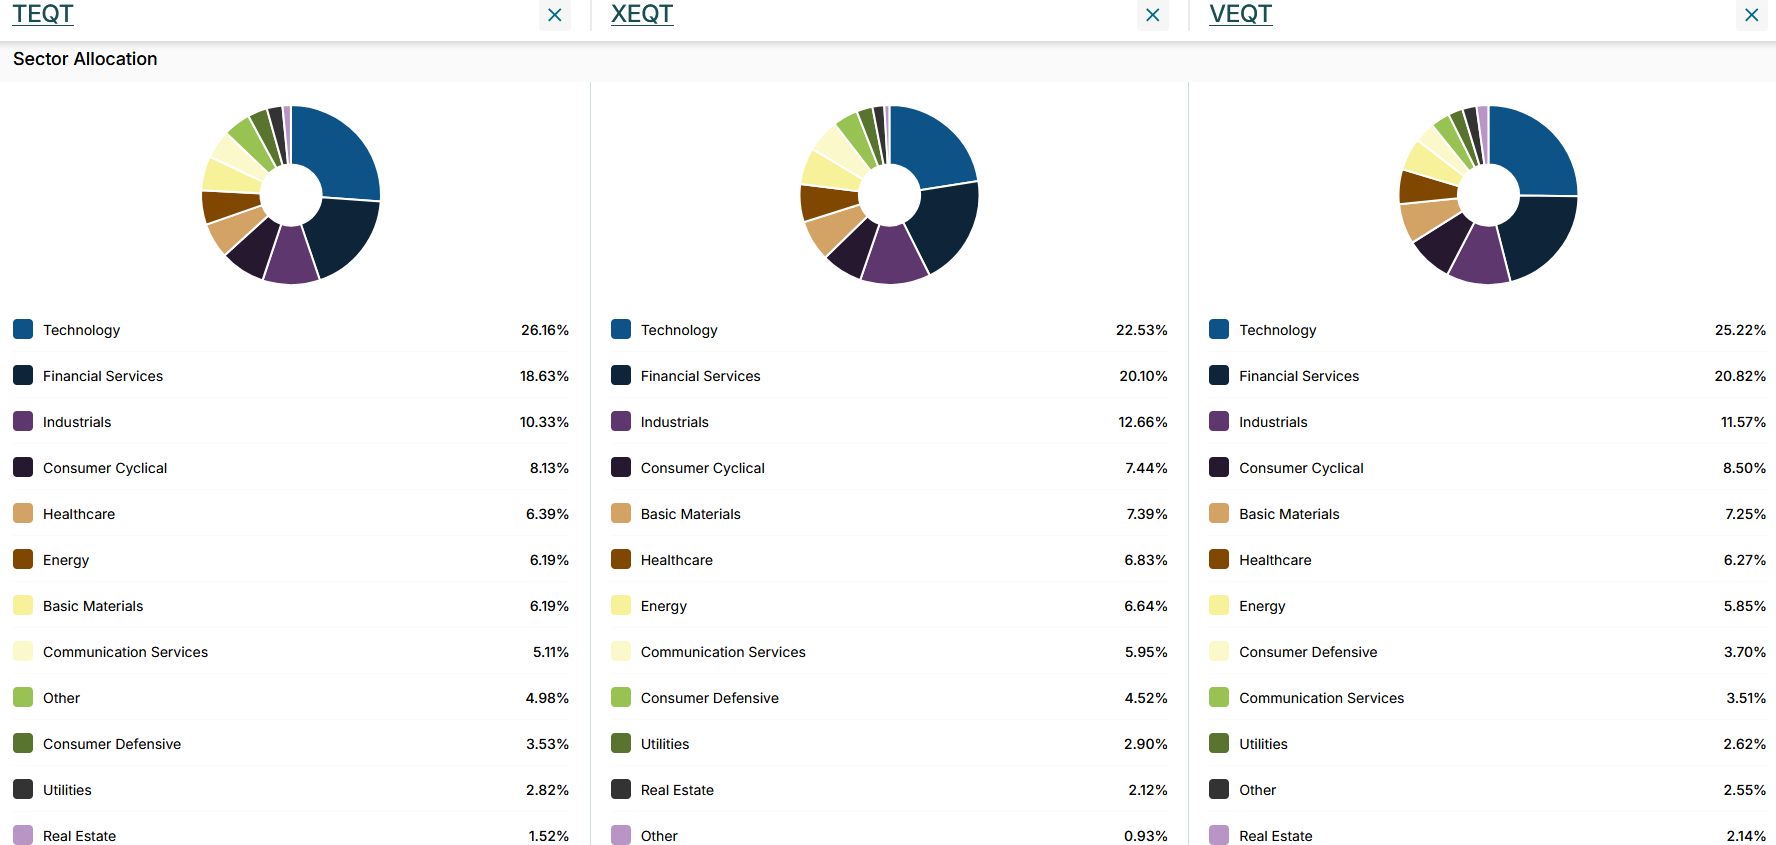
Source: TMX
There's another structural difference worth mentioning. TEQT builds its portfolio entirely from Canadian-domiciled TD ETFs. XEQT also uses a fund-of-funds structure, but some of its underlying exposure is obtained through U.S.-listed iShares ETFs. For most investors choosing among these three funds, I would consider this another relatively minor consideration.
Is TEQT Better Than XEQT or VEQT?
I wouldn't spend too much time suffering from analysis paralysis here. TEQT has some legitimate advantages. Its 0.17% MER is slightly lower, and investors who deliberately want to avoid emerging markets may prefer its 25% Canada, 55% U.S. and 20% developed international target allocation.
XEQT and VEQT provide broader geographic diversification by including emerging markets, have substantially larger asset bases and now have fees close enough to TEQT that the difference amounts to only a few dollars annually for most portfolios. Between them, VEQT provides the largest Canadian home-country bias, while XEQT sits somewhat closer to TEQT.
In other words, pick whichever ticker's portfolio you prefer and, more importantly, stick with it. The behavioural benefit of consistently contributing, automatically reinvesting distributions and resisting the temptation to jump between nearly identical asset allocation ETFs will probably matter much more than a two-basis-point fee difference.
There may even be a use for their differences in taxable accounts. Because TEQT, XEQT and VEQT hold different underlying portfolios and follow different allocation methodologies, they could potentially serve as tax-loss harvesting partners. Investors considering that strategy should still consult a tax professional regarding the CRA’s superficial-loss rules before making a switch.