DRAM and ACHP: Canada’s First ETFs for Memory Chips and Asian Semiconductors
Last Updated:
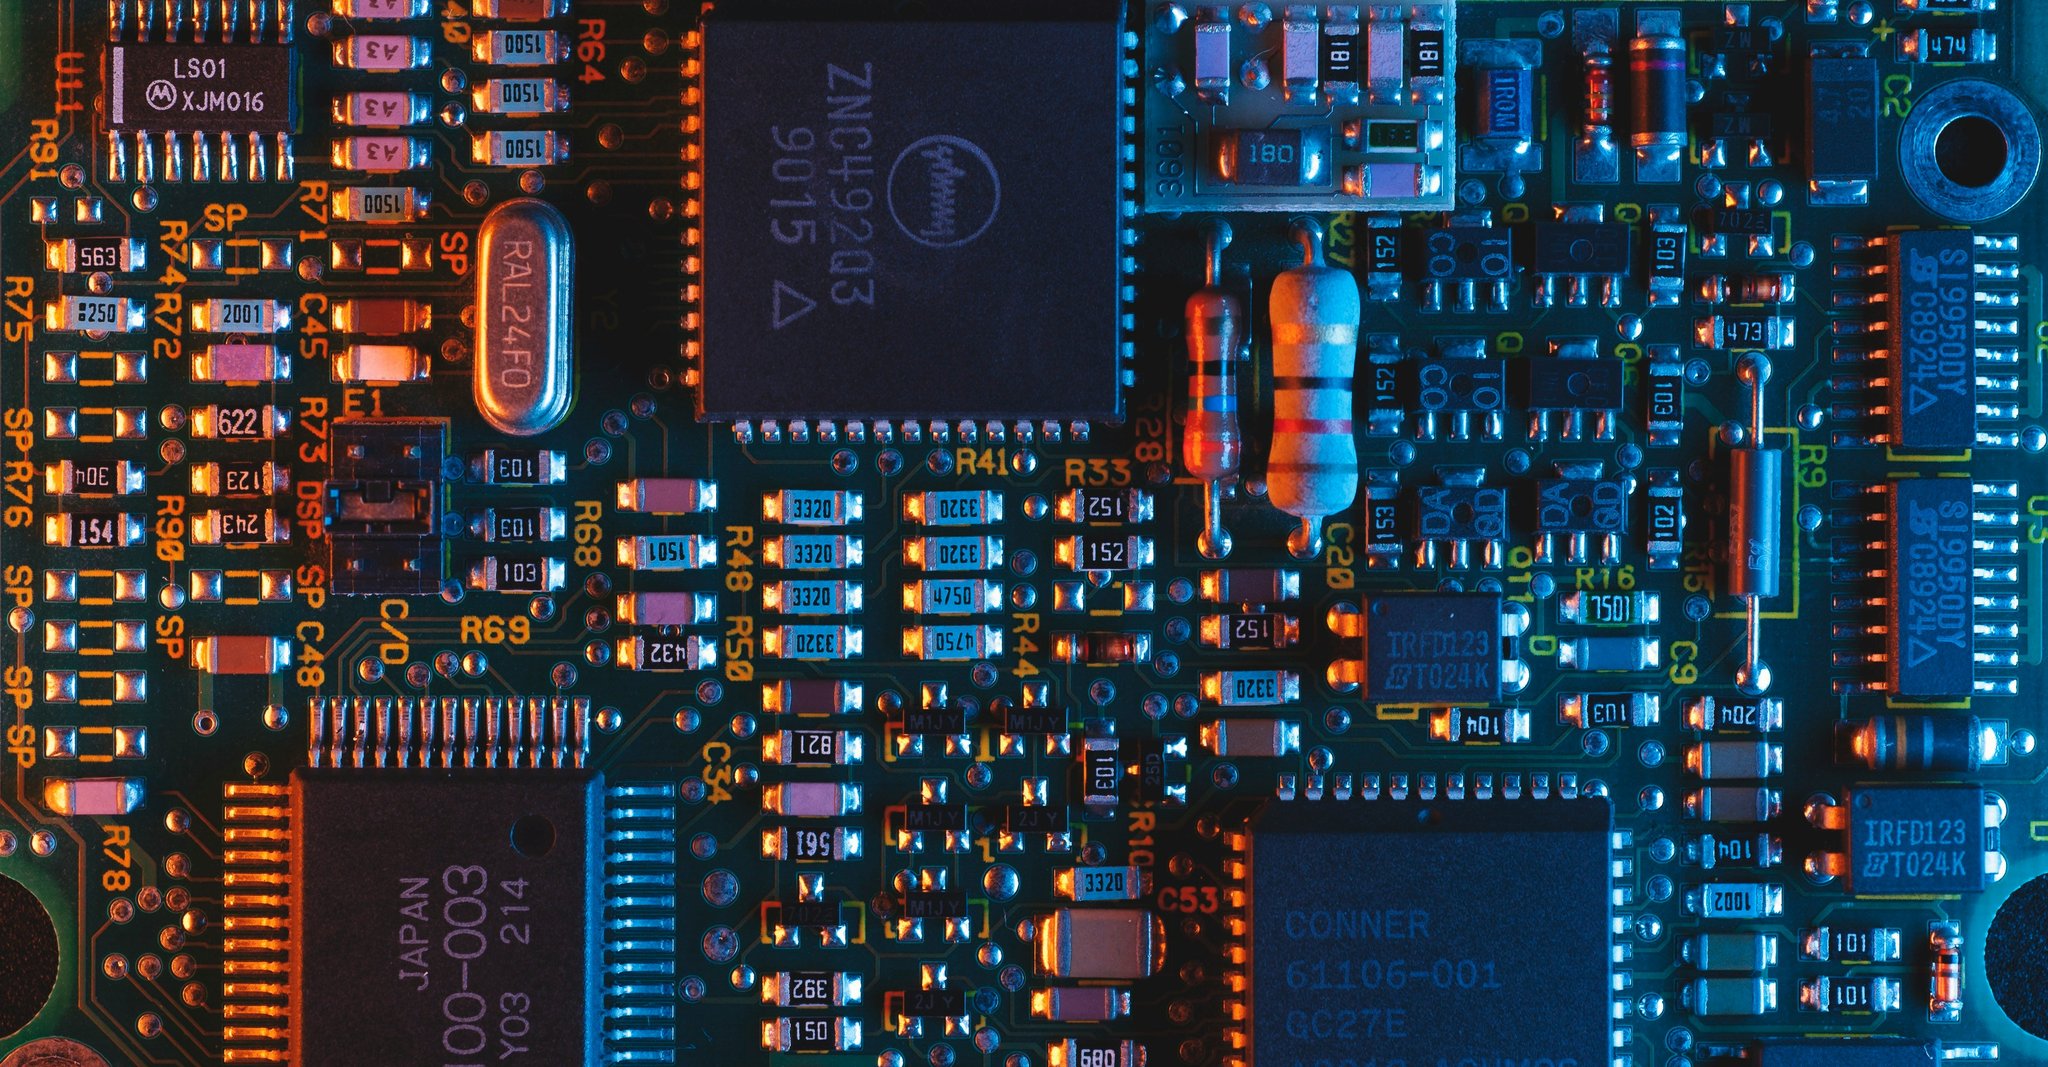
AI may be a software revolution, but increasingly, it is being financed like an infrastructure buildout. Consider the amount of capital already moving through the system. Amazon, Alphabet, Meta, and Microsoft collectively planned more than $400 billion of capital spending in 2025, much of it tied to the data centres and computing capacity required for AI.
Looking further out, McKinsey estimates that nearly $7 trillion could be invested globally in data-centre infrastructure through 2030, with more than $4 trillion directed specifically toward computing hardware. Roughly $1 trillion of investment could flow into semiconductor production through 2030. Global data-centre demand itself could almost triple from roughly 82 gigawatts in 2025 to 220 gigawatts by 2030.
Those numbers help explain why I increasingly think the AI investment story needs to be viewed as a value chain rather than a handful of familiar high-beta mega-cap growth stocks. Training and running increasingly capable models require accelerators, memory, networking, foundry capacity, packaging, power, cooling, and the physical infrastructure connecting all of it.
For Canadian investors, Global X Canada already offers several ways to approach different portions of the AI buildout, including the Global X Artificial Intelligence & Technology Index ETF (AIQ), the Global X Artificial Intelligence Semiconductor Index ETF (CHPS), and the Global X Artificial Intelligence Infrastructure Index ETF (MTRX).
But that still left portions of the AI value chain that can be harder to isolate, until now. Global X Canada recently expanded their thematic AI ETF lineup with the Global X Artificial Intelligence Memory Index ETF (DRAM) and Global X Asia Semiconductor Index ETF (ACHP), both of which are currently the first and only of their respective segment in the Canadian ETF market.
AI infrastructure investment is expanding, but the capital is not flowing evenly across the value chain. For investors who want to look beyond the broad AI trade, DRAM and ACHP potentially provide two more targeted lenses on where spending, capacity, and competition are developing within the hardware ecosystem.
The Memory Layer Behind the AI Arms Race
The first wave of the AI hardware trade was dominated by processing power. GPUs became scarce because training increasingly large models required enormous amounts of compute. Memory is now emerging as another capacity constraint, because those processors are only useful if data can be supplied to them quickly enough. It helps to distinguish the major forms first, though.
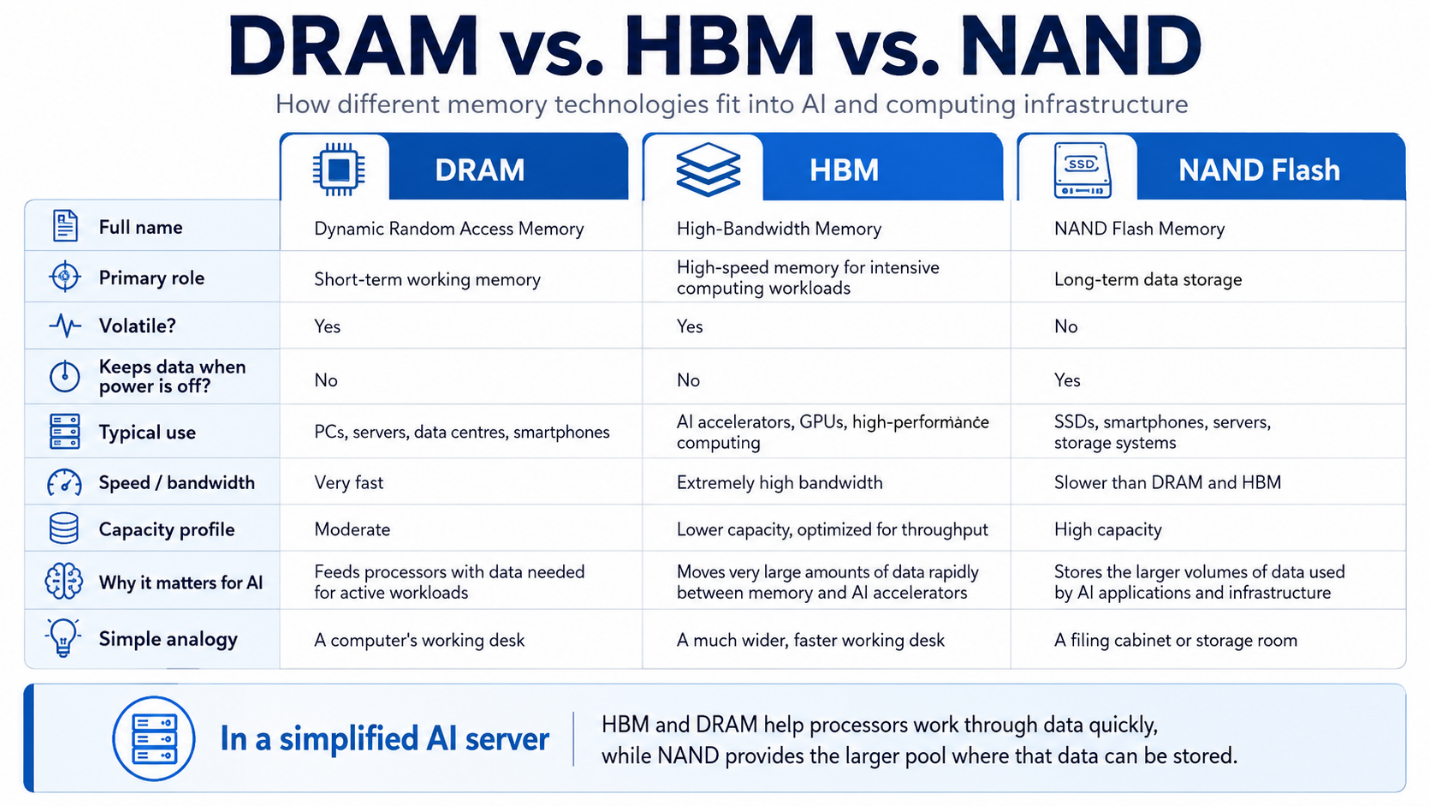
Dynamic random - access memory, or DRAM, functions as a computer's short-term working memory. It temporarily holds the data a processor needs immediately, providing extremely fast access but losing that information when power is removed. High-bandwidth memory, or HBM, is an advanced form of DRAM that stacks multiple memory dies vertically to move much larger quantities of data.
NAND flash serves a different purpose. It retains information after power is switched off, making it the technology behind solid-state drives and much of the storage used in smartphones, PCs, servers, and data centres. In a simplified AI server, HBM and DRAM help processors work through data quickly, while NAND provides the much larger pool where that data can be stored.
Growing Demand for Memory
AI is increasing the requirements for both. Data centres accounted for roughly 50% of worldwide DRAM consumption in 2025, up from about 32% five years earlier, and AI servers could account for more than 60% of global DRAM consumption by 2030. At the same time, increasingly memory-intensive inference workloads are driving demand for NAND as AI systems retain and retrieve growing amounts of data. Predictably, memory manufacturer revenue and market share have skyrocketed.
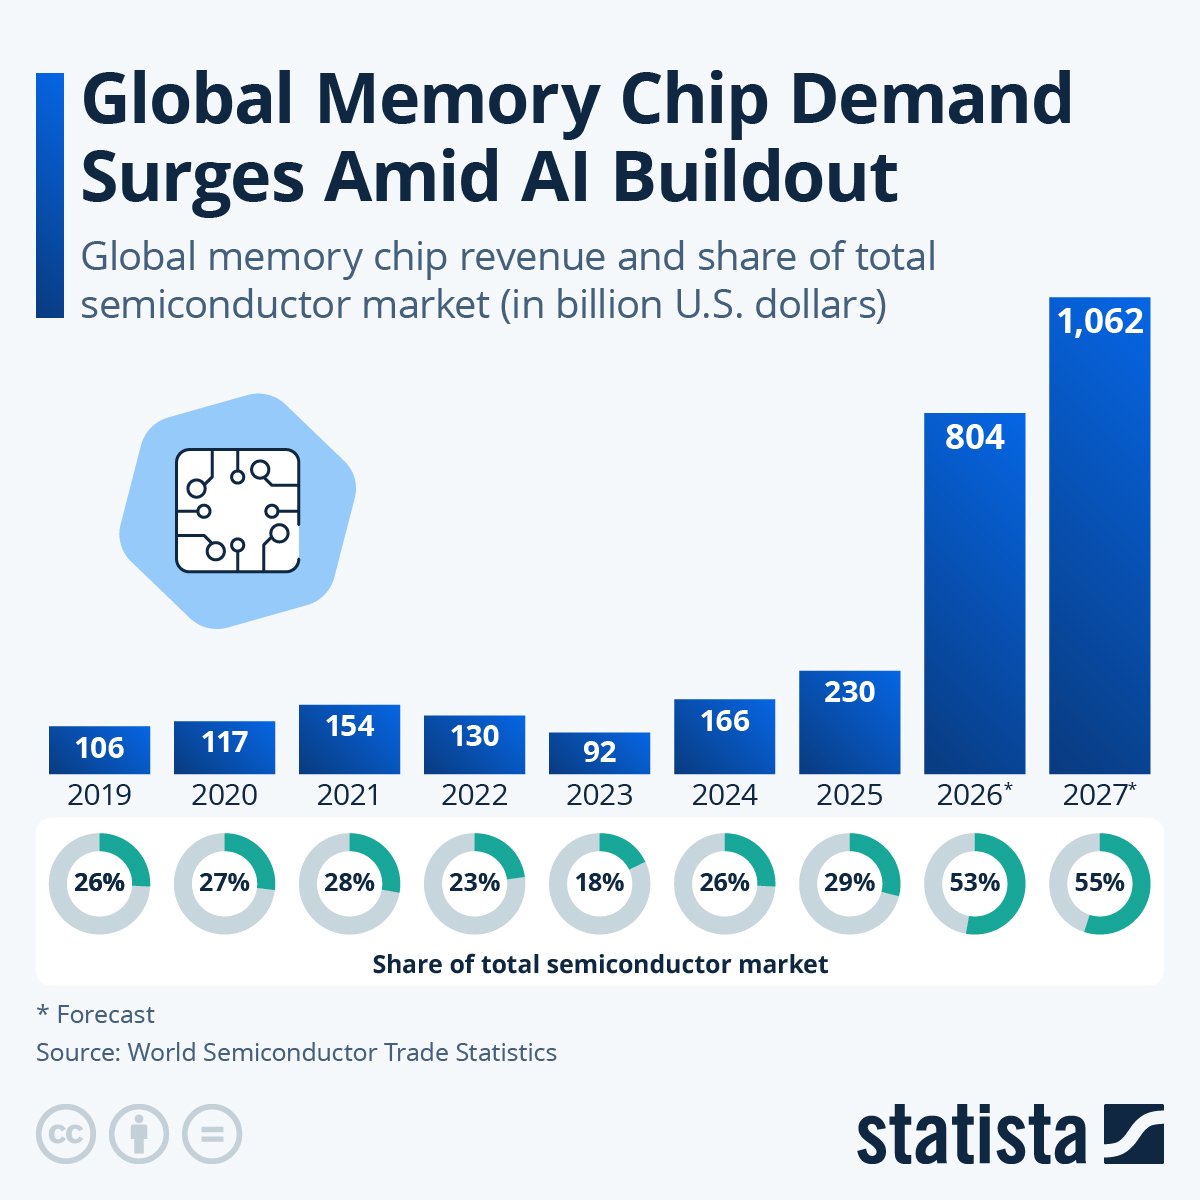
Source: Statista as of September 1, 2026
The supply side is also unusually concentrated in terms of key players. For example, Samsung Electronics, SK Hynix, and Micron Technology control more than 90% of global DRAM production. Each occupies a different pole position. SK Hynix has established itself as a leading HBM supplier for AI accelerators. Samsung operates across DRAM, HBM, NAND, foundry, and other semiconductor markets. Micron provides DRAM, HBM, and NAND and represents the major U.S.-headquartered memory manufacturer.
Adding supply is difficult because of challenging manufacturing conditions. Multiple memory dies must be stacked and connected with extremely fine tolerances, and defects can reduce the yield of the completed stack. New fabrication and packaging capacity also requires billions of dollars and several years to build. The result is a market where rapidly increasing AI demand cannot necessarily be matched by an equally rapid supply response.
The Memory Supply Squeeze
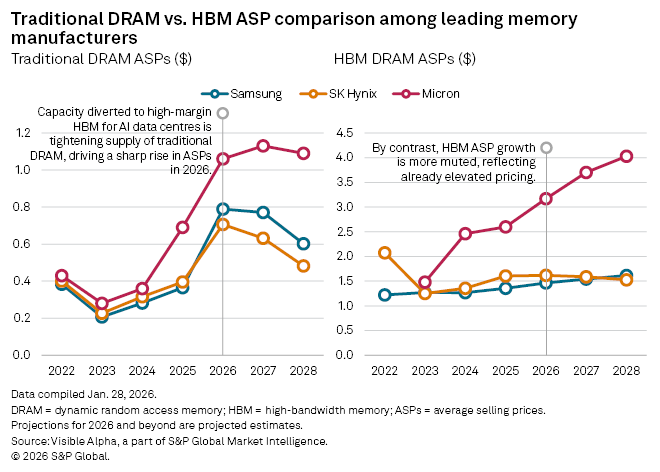
That imbalance has become visible across the industry. Memory prices rose sharply through late 2025 and 2026, while the major producers shifted toward longer-term arrangements with their largest AI customers. Samsung has discussed contracts extending three to five years. Micron has similarly entered what it calls strategic customer agreements while increasing investment in manufacturing capacity.
That is notable because memory has traditionally been one of the semiconductor industry's most cyclical businesses. Producers would add capacity during periods of strong pricing, supply would eventually catch up, and the resulting glut would push prices and margins back down. The current AI buildout is testing whether that cycle may become longer because customers are prioritizing access to supply.
Source: S&P Global as of January 28, 2026
The Financial Times reported in April that industry participants expected the supply crunch to persist until at least 2028. By September, SK Hynix was publicly discussing the possibility that the global memory shortage could last through 2030 as AI infrastructure investment continues. Samsung similarly said after its second-quarter results that server DRAM, enterprise SSD, and HBM demand was expected to keep the memory market undersupplied despite efforts to increase production.
Now, there are risks to that thesis. Semiconductor purchase commitments can still be revised, deferred, or renegotiated if industry conditions change. Memory remains cyclical and enormous amounts of new capacity are being planned. Samsung and SK Hynix alone are part of a roughly $590 billion Korean semiconductor capacity expansion plan, illustrating how aggressively the industry is responding to today's economics. If supply ultimately catches demand, pricing power and margins could normalize.
Moreover, calling every component a "bottleneck" can become repetitive, just as the "picks and shovels" analogy has been applied to almost everything associated with AI. But I still think the near-term setup resembles an earlier stage of the AI buildout. GPUs initially received attention because there were too few accelerators relative to demand. The constraint has since spread further through the hardware stack.
How DRAM Captures Memory Exposure
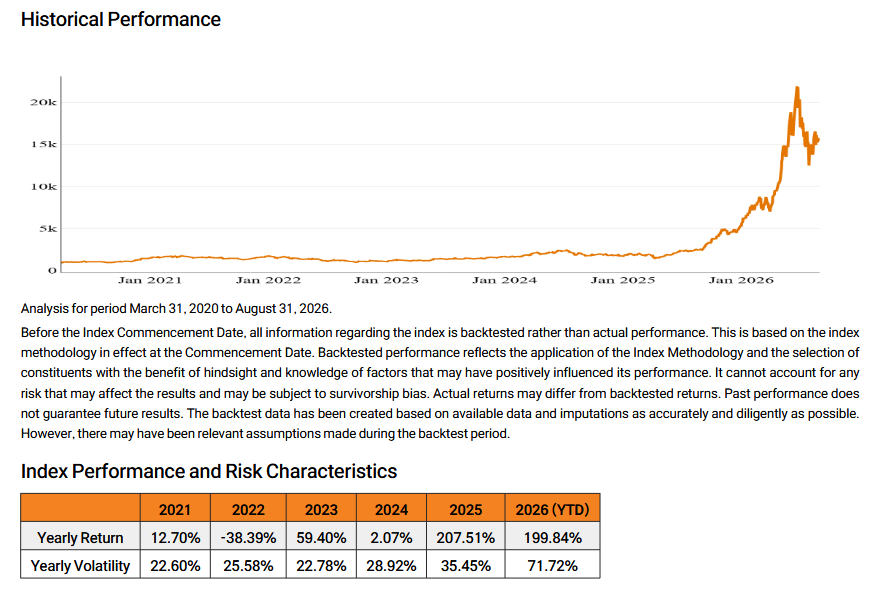
DRAM tracks the Mirae Asset Artificial Intelligence Memory Index and carries a 0.49% management fee. The Index focuses on two parts of the industry: memory semiconductors, including DRAM, NAND, HBM, and other specialized memory technologies, and storage companies producing the hardware used to store and retrieve information across cloud, enterprise, and AI infrastructure.
Source: Mirae Asset Global Indices as of August 31, 2026.
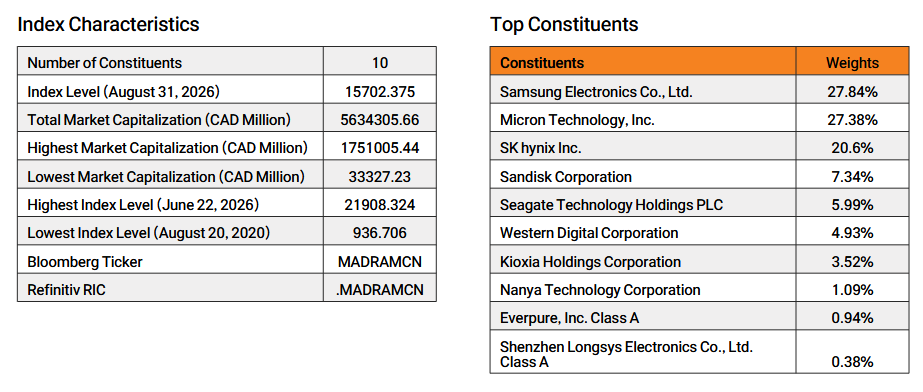
The benchmark is intentionally concentrated, with a maximum of 10 holdings. Companies are ranked primarily using memory-related revenue, with up to five selected from each of the memory semiconductor and storage sub-themes.
New constituents generally need at least $3 billion in company-level market capitalization, sufficient trading liquidity, and at least 10% free float. Companies qualifying beyond the largest revenue leaders generally must derive at least 50% of revenue from memory-related activities and generate at least $1 billion of absolute memory-related revenue.
Eligible listings can come from the United States, Japan, South Korea, China, Hong Kong, and Taiwan. That global mandate matters in memory because some of the industry's most important companies sit outside North American benchmarks. Constituents are ultimately weighted by free-float market capitalization, with each position capped at 25%. The result is a concentrated strategy by design.
Source: Mirae Asset Global Indices as of August 31, 2026.
For investors who believe the AI buildout will continue to increase the amount of data that must be processed, moved, and stored, memory provides a more targeted way to express that view. The trade-off is equally clear though: a portfolio concentrated in a small number of memory producers may carry substantially more volatility due to industry, geographic, pricing-cycle, and company-specific risk.
Beyond Korea in Asia’s Semiconductor Arms Race
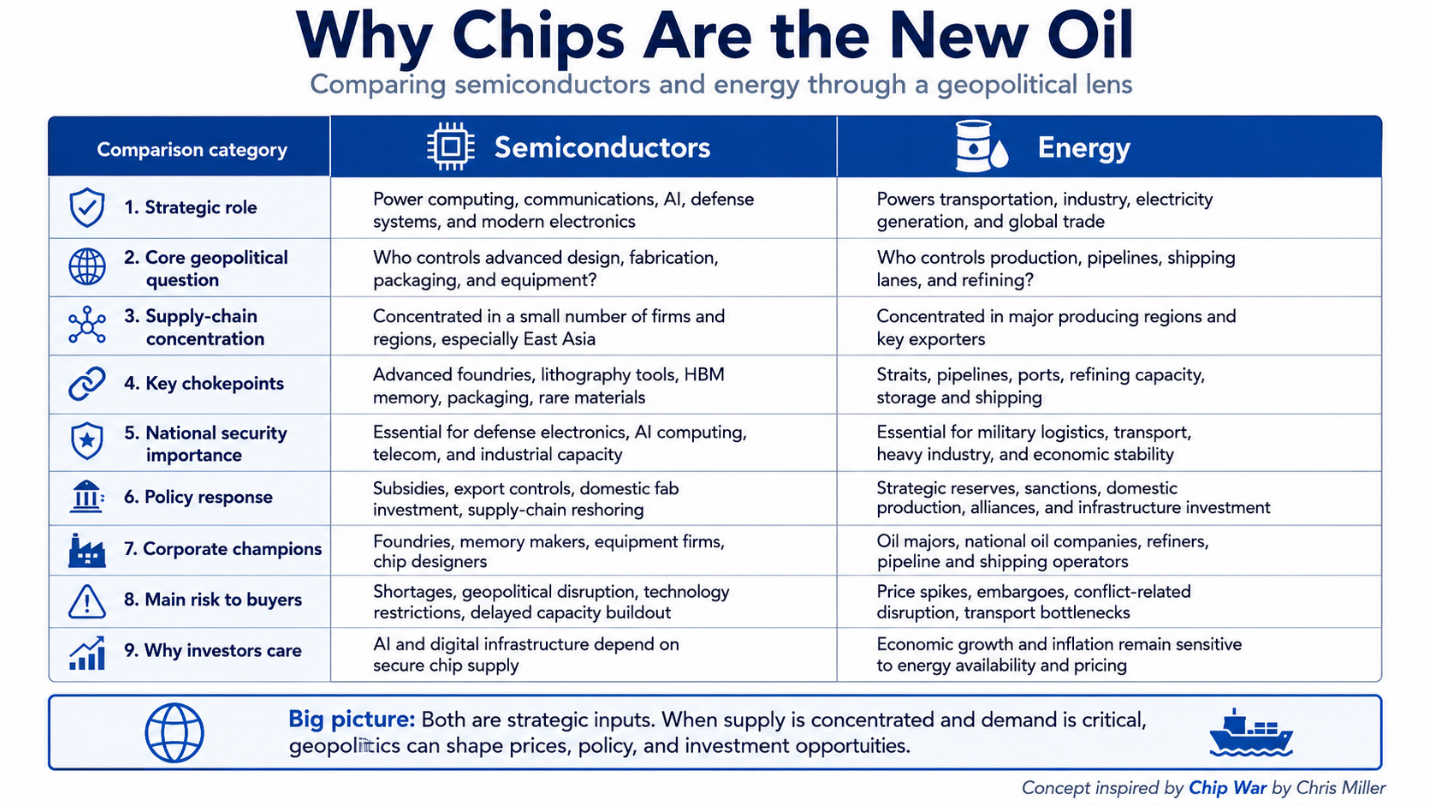
Chris Miller’s Chip War frames the strategic importance of the semiconductor industry with a useful line: “Microchips are the new oil—the scarce resource on which the modern world depends. I think the analogy works well because semiconductor production, like energy, is inseparable from geopolitics.
Source: Chris Miller as of September 3, 2026.
A modern chip can be designed in the United States, manufactured in Taiwan, rely on Japanese chemicals and equipment, incorporate Korean memory, and ultimately be packaged, tested, or assembled somewhere else in Asia. Decades of globalization created this specialization because putting every part of the semiconductor value chain in one country (reshoring) is extraordinarily expensive.
Now, South Korea is defending an existing position of strength rather than trying to create one from scratch. Samsung Electronics and SK Hynix plan more than $520 billion of investment in additional semiconductor manufacturing capacity, including new memory fabs and packaging facilities, against a backdrop where AI-driven semiconductor exports have become an increasingly important contributor to the Korean economy. But they aren’t the only semiconductor players in Asia anymore.
Taiwan is the Big Fish in a Small Pond
Semiconductor supply chain specialization also created concentrated points of risk. The pandemic demonstrated how quickly shortages of relatively inexpensive chips could disrupt automobiles, electronics, and industrial production. More recently, U.S.-China technology restrictions and tensions surrounding Taiwan have turned semiconductor manufacturing capacity into a national-security priority.
Taiwan’s “Five Trusted Industry Sectors” strategy specifically identifies semiconductors and AI as national priorities, with policies aimed at maintaining leadership in advanced manufacturing, packaging, materials, and equipment. TSMC, meanwhile, raised its own 2026 capital budget to between $60 billion and $64 billion, with roughly 70% to 80% earmarked for advanced process technologies and another 10% to 20% for areas including advanced packaging and testing.
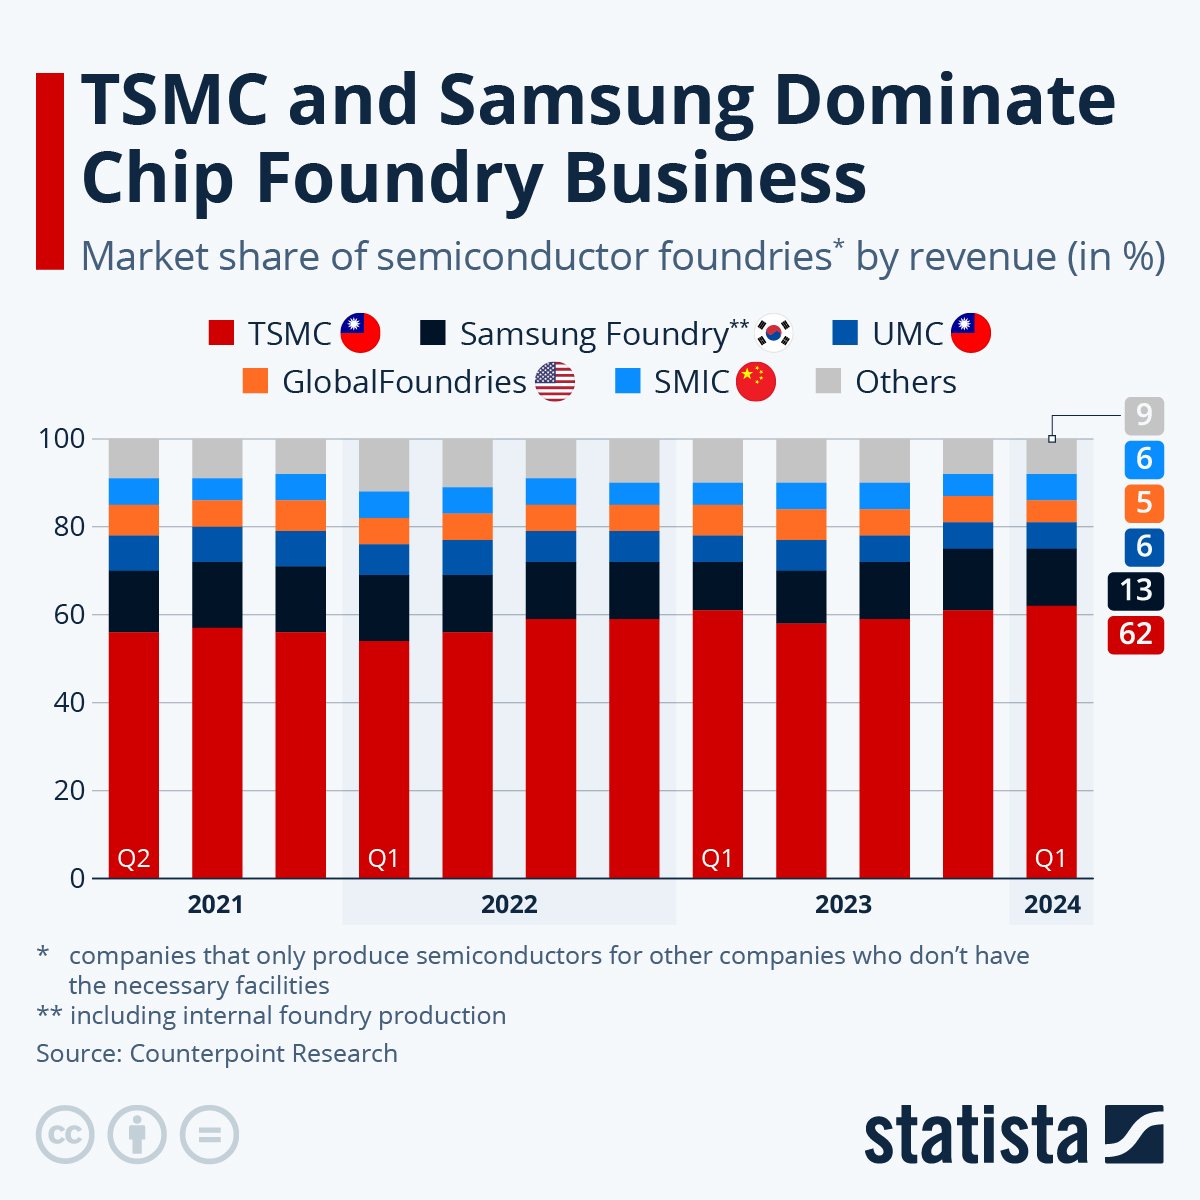
Source: Statista as of July 19, 2024.
Beyond TSMC, MediaTek is the other notable company to watch. This Taiwanese company is fabless, meaning it designs chips while outsourcing their physical production. Historically associated with smartphones and connectivity, MediaTek has been expanding. The company generated a record $19.1 billion of revenue in 2025 and subsequently raised its 2026 AI data-centre ASIC revenue guidance to $2 billion. Management sees a $70 billion to $80 billion addressable market for AI data centres by 2027.
Finally, there is Nanya, a Taiwanese DRAM manufacturer. During the first half of 2026, products serving AI infrastructure and server applications accounted for more than 20% of company revenue. The company is now planning a major capacity expansion, including up to NT$69.7 billion of capital expenditure in 2026 and a new fab expected to ultimately cost roughly $16 billion at full capacity
China Is Doubling Down
China is pursuing the same objective from the opposite side of U.S. export restrictions. Its third National Integrated Circuit Industry Investment Fund raised RMB344 billion, or roughly $47 billion, to finance domestic semiconductor capabilities, while Beijing has increasingly directed procurement toward locally produced AI processors. Cambricon and Huawei chips were added to government procurement guidance as China attempts to reduce its reliance on Nvidia and other foreign suppliers.
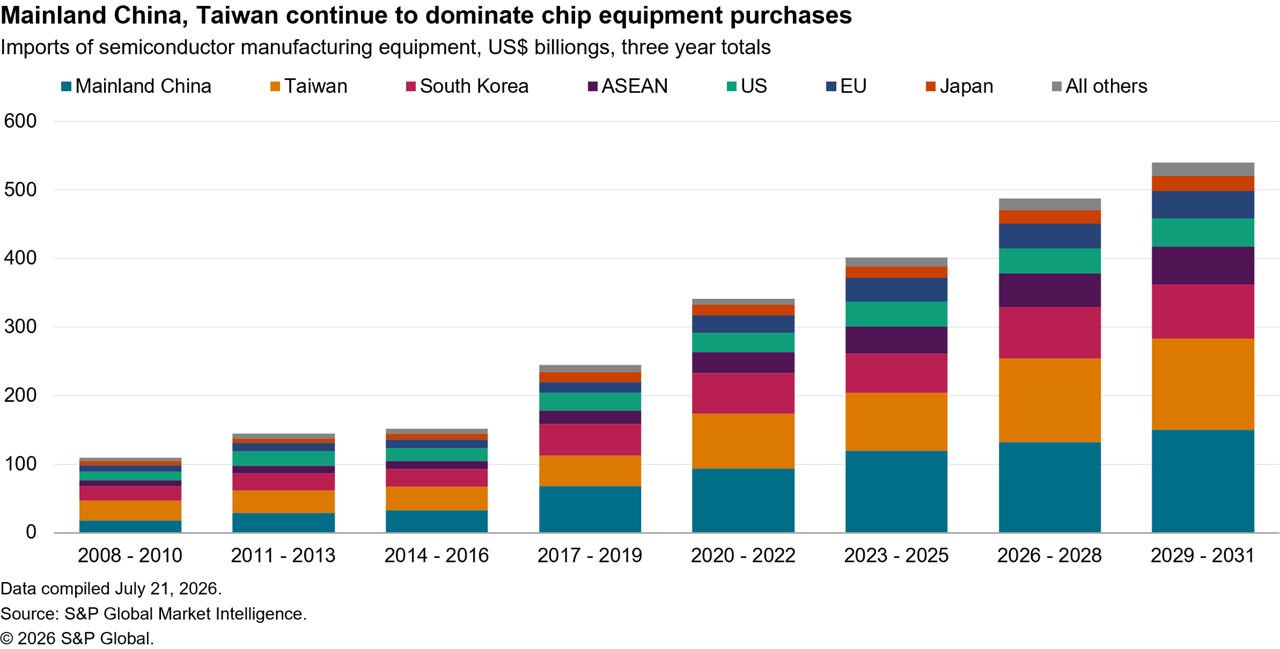
Source: S&P Global as of July 28, 2026.
Cambricon is notable because the company sits directly inside China's effort to develop alternatives to U.S. AI accelerators. The company evolved from smartphone AI processors toward cloud and edge AI chips and has become one of the more prominent public-market beneficiaries of China's push for semiconductor self-sufficiency. It reported roughly RMB1 billion of profit during the first half of 2025.
That being said, the risks are equally important. Cambricon operates amid U.S. technology restrictions, depends on China's ability to expand domestic semiconductor manufacturing, and competes against both Nvidia and larger Chinese companies such as Huawei. Investors are therefore getting exposure to China's semiconductor ambitions along with the considerable geopolitical and execution risk attached.
How ACHP Captures Asian Semiconductor Exposure
ACHP tracks the Mirae Asset Asia Semiconductor Index and carries a 0.49% management fee. The benchmark is designed specifically around semiconductor companies connected to Asia rather than simply taking a global semiconductor index and changing its weights.
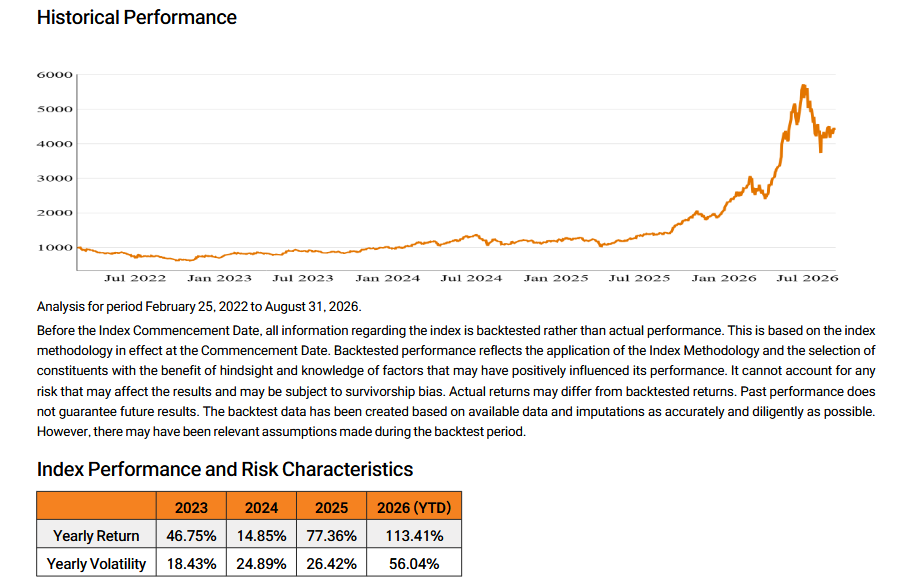
Source: Mirae Asset Global Indices as of August 31, 2026.
Securities can be listed in the United States, Japan, South Korea, China, Hong Kong, Indonesia, Malaysia, the Philippines, Singapore, Taiwan, or Thailand. U.S.-listed securities can qualify when the underlying company is incorporated or domiciled in one of the eligible Asian countries. There are also minimum investability requirements for size and liquidity.
The three companies with the largest absolute semiconductor-related revenues can qualify automatically provided they meet the broader eligibility requirements. Beyond those leaders, companies generally must derive at least 50% of revenue from semiconductor-related businesses while generating at least $500 million of semiconductor-related revenue. Existing constituents receive a slightly lower $400 million absolute-revenue threshold while maintaining the same 50% revenue requirement.
The final index holds no more than 20 companies with a 20% cap, selected primarily by company-level market capitalization once the semiconductor revenue tests have been applied. Constituents are then weighted using free-float market capitalization.
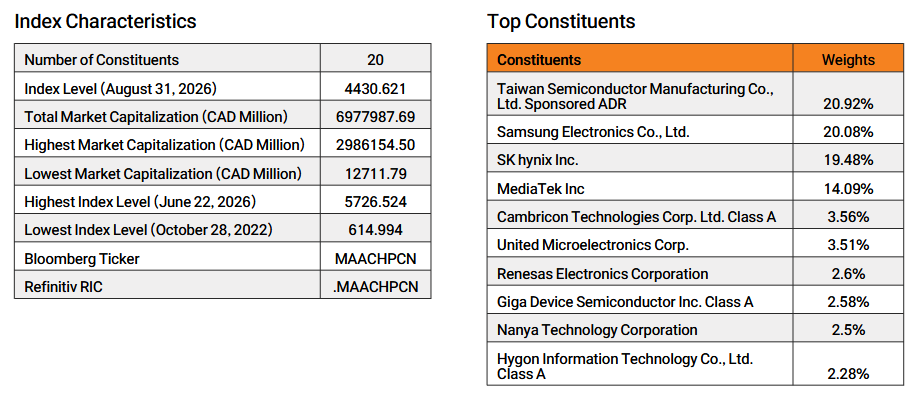
Source: Mirae Asset Global Indices as of August 31, 2026.
The attraction of ACHP is also one of its primary risks. Investors gain access to semiconductor markets that can be difficult to capture through a U.S.-centric ETF like CHPS, but they also take on greater country, currency, regulatory, and geopolitical exposure. Taiwan Strait risk, U.S.-China export restrictions, and Chinese industrial policy can all materially affect individual holdings.
But that is ultimately the thesis ACHP aims to capture. AI may have intensified the demand for chips, but the competition over who designs them, manufactures them, supplies the memory, and packages them is increasingly being fought across the Asian market.