
Invesco Dow Jones Industrial Average Dividend ETF (DJD) Review
Last Updated:

I'm not a particularly big fan of the Dow Jones Industrial Average. Price weighting made sense over a century ago when index calculations were done by hand, but today market-cap weighting, which multiplies a company's share price by its shares outstanding, is generally the more sensible approach.
Even so, the Dow has endured, and part of that comes down to familiarity. Financial media still quotes it every day (“Dow 50,000!”), and for many investors, "the Dow" remains synonymous with the U.S. stock market. Whether that's justified is another discussion, but its popularity has helped spawn a variety of investment strategies built around its 30 blue-chip constituents.
One of the best known is the Dogs of the Dow strategy. The concept is straightforward: each year, identify the 10 highest-yielding Dow components, invest in them equally, then repeat the process the following year. The idea is that temporarily out-of-favour blue-chip companies often offer both attractive dividend income and the potential for price recovery.
Investors can access a variation of that strategy through the Invesco Dow Jones Industrial Average Dividend ETF (DJD). It's hardly one of the most talked-about dividend ETFs. With roughly $475 million in assets under management, it isn't at risk of closing, but compared with the industry's largest dividend funds, it remains well under the radar.
Even so, DJD has been on my watch list for quite some time. Despite the shortcomings of its underlying benchmark, there are several aspects of the ETF that I think deserve more attention.
DJD: What I Like
DJD starts with the dividend-paying companies in the Dow Jones Industrial Average. Today, that means 28 of the index's 30 constituents. Rather than weighting them by share price like the Dow itself, the ETF weights them according to their trailing 12-month dividend yield and rebalances the portfolio semi-annually. It's not exactly the classic Dogs of the Dow strategy, but it is a systematic, rules-based variation.
The first thing I like about DJD is its cost. The ETF charges a net expense ratio of just 0.07%. For comparison, the SPDR Dow Jones Industrial Average ETF Trust (DIA), which simply tracks the traditional price-weighted Dow, charges 0.16%, more than twice as much. Dividend ETFs often command a premium over plain index funds, so DJD is a welcome exception.
The yield-weighting methodology also produces an interesting side effect. By allocating more capital to higher-yielding companies, the portfolio naturally tilts toward the value factor. Today, DJD trades at a forward price-to-earnings ratio of 18.26 times, well below the S&P 500, while still maintaining impressive quality characteristics, including an average return on equity of 27.57%.
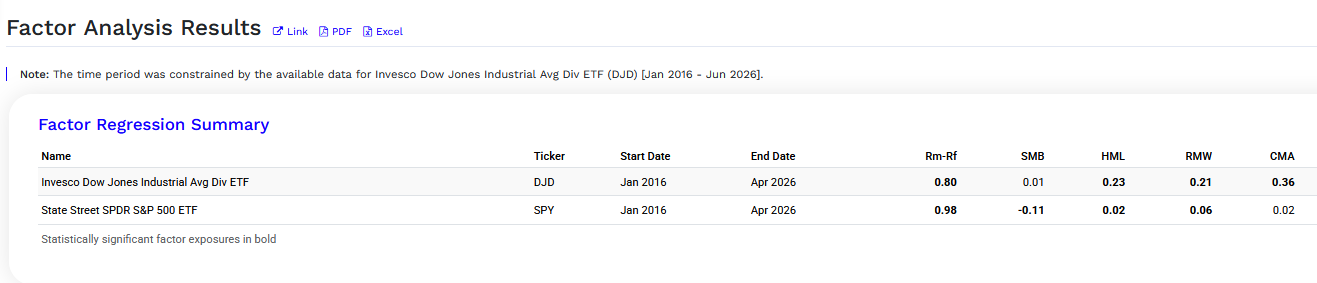
Running a factor regression against the SPDR S&P 500 ETF Trust (SPY) also reveals favorable exposure to the value, profitability, and investment factors. In other words, DJD quietly delivers many of the characteristics investors seek from dedicated factor ETFs, but does so through a simple dividend methodology and at a much lower cost than many branded smart beta products.
Source: Portfolio Visualizer
The income profile is attractive as well. DJD currently offers a 2.43% 30-day SEC yield with quarterly distributions, comfortably above that of the broader U.S. market. Because the Dow Jones Industrial Average does not include REITs, the ETF avoids ordinary-income distributions. As a result, most of DJD's payouts are generally eligible for the more favorable qualified dividend tax treatment.
DJD: What I Dislike
While I think yield weighting is a far more sensible approach than price weighting, DJD still inherits the biggest weakness of its parent benchmark. Unlike most modern indexes, the Dow is not constructed using a transparent, quantitative methodology.
Instead, its constituents are selected by a committee consisting of three representatives from S&P Dow Jones Indices and two from The Wall Street Journal. Those five members determine which companies enter and leave the index based on qualitative factors such as corporate reputation, investor interest, and growth prospects.
That introduces a significant amount of discretion. Rather than allowing objective rules to determine membership, the process resembles active stock selection conducted behind closed doors. In that sense, I view the Dow as an index in name only. The underlying security selection is ultimately driven by human judgment rather than a systematic methodology.
The index's small size is another drawback. With only 30 constituents, the Dow is already much less diversified than broad benchmarks like the S&P 500. DJD narrows that universe further by excluding the two Dow components that currently do not pay dividends, leaving investors with just 28 holdings.
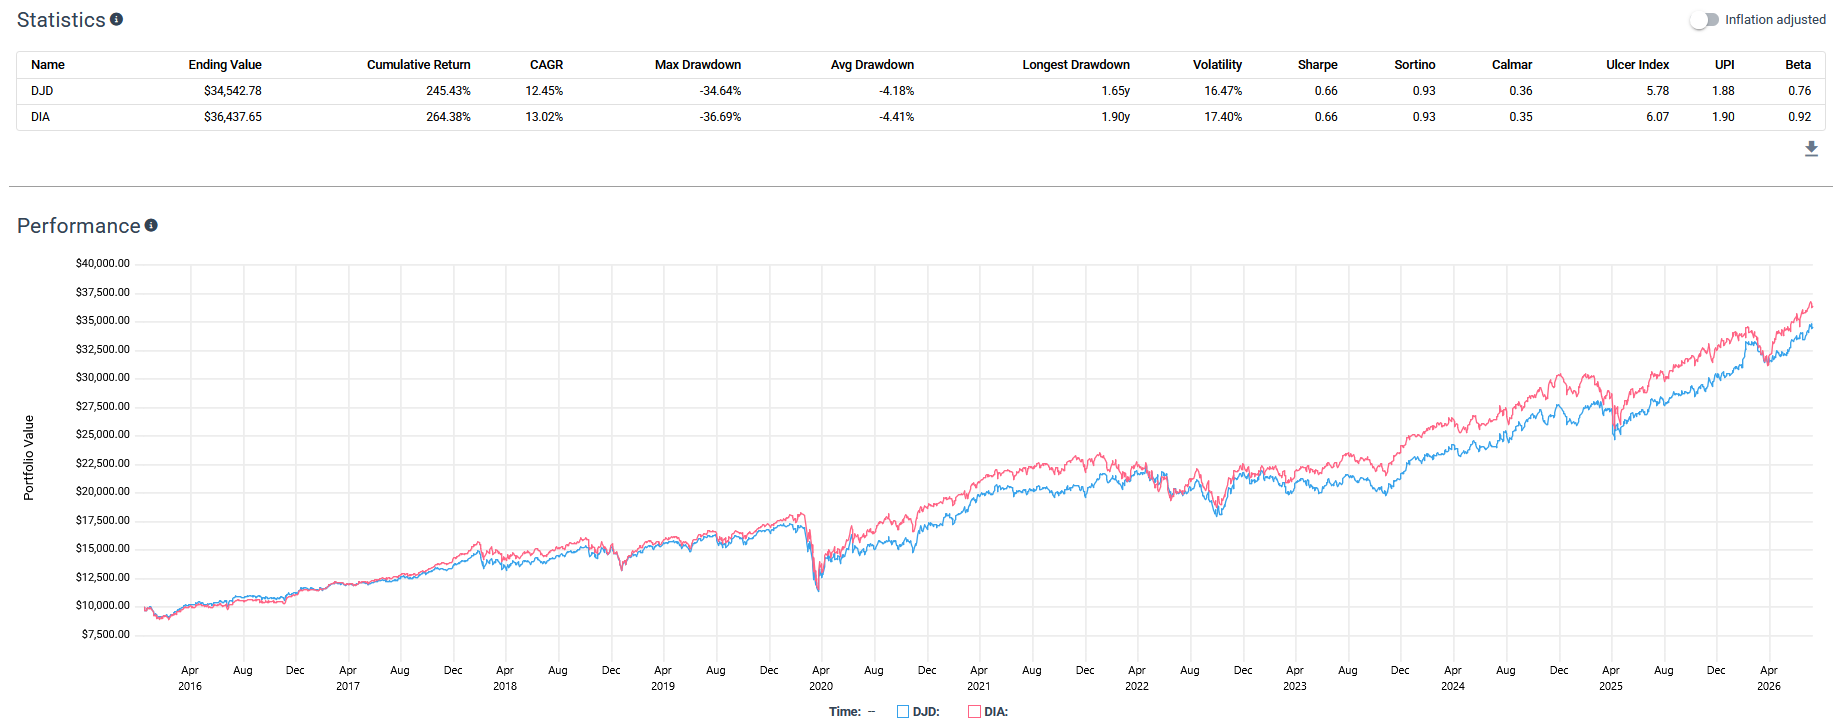
Finally, over the trailing 10-year period, DJD has still underperformed DIA on a total return basis, despite being cheaper. That said, it has exhibited slightly lower volatility and somewhat shallower drawdowns, resulting in identical risk-adjusted returns.
Source: Testfolio
That's a recurring characteristic of many dividend strategies. By tilting toward value-oriented companies, they often sacrifice exposure to faster-growing businesses. Ironically, the traditional price-weighted Dow, outdated as its methodology may be, still ends up with a modest momentum tilt because companies with rising share prices naturally become more influential within the index.
DJD: My Verdict
Overall, I'd give DJD a 7 out of 10. Its biggest strengths are its low 0.07% expense ratio, attractive dividend yield, tax-efficient distributions, and the fact that its yield-weighting methodology provides inexpensive exposure to the value and quality factors.
What keeps it from earning a higher score is the benchmark itself. The discretionary committee-based selection process and the limited universe of just 30 Dow constituents make the underlying index feel dated compared to the transparent, rules-based methodologies used by many modern ETFs.
If you're comfortable with those limitations, DJD remains one of the more interesting under-the-radar dividend ETFs available today. I just wish it were built on a stronger underlying benchmark.