Hamilton Enhanced Canadian Covered Call ETF (HDIV) 5-Year Anniversary: A Look Back at a Flagship Monthly Income ETF
Last Updated:

More than five years ago, the team at Hamilton ETFs had an interesting idea: could some of the capped upside limitations inherent in covered call ETFs be offset by adding a modest amount of leverage?
That idea ultimately resulted in the Hamilton Enhanced Canadian Covered Call ETF (HDIV), originally launched as the Hamilton Multi-Sector Covered Call ETF on July 19, 2021. The strategy combined exposure to Canadian covered call ETFs with 1.25x leverage.
Five years later, the results provide an opportunity to evaluate how that approach has worked in practice. As of September 30, 2026, HDIV has delivered outperformance relative to the S&P/TSX 60 Index since inception, all while providing a higher yield through consistent monthly distributions.
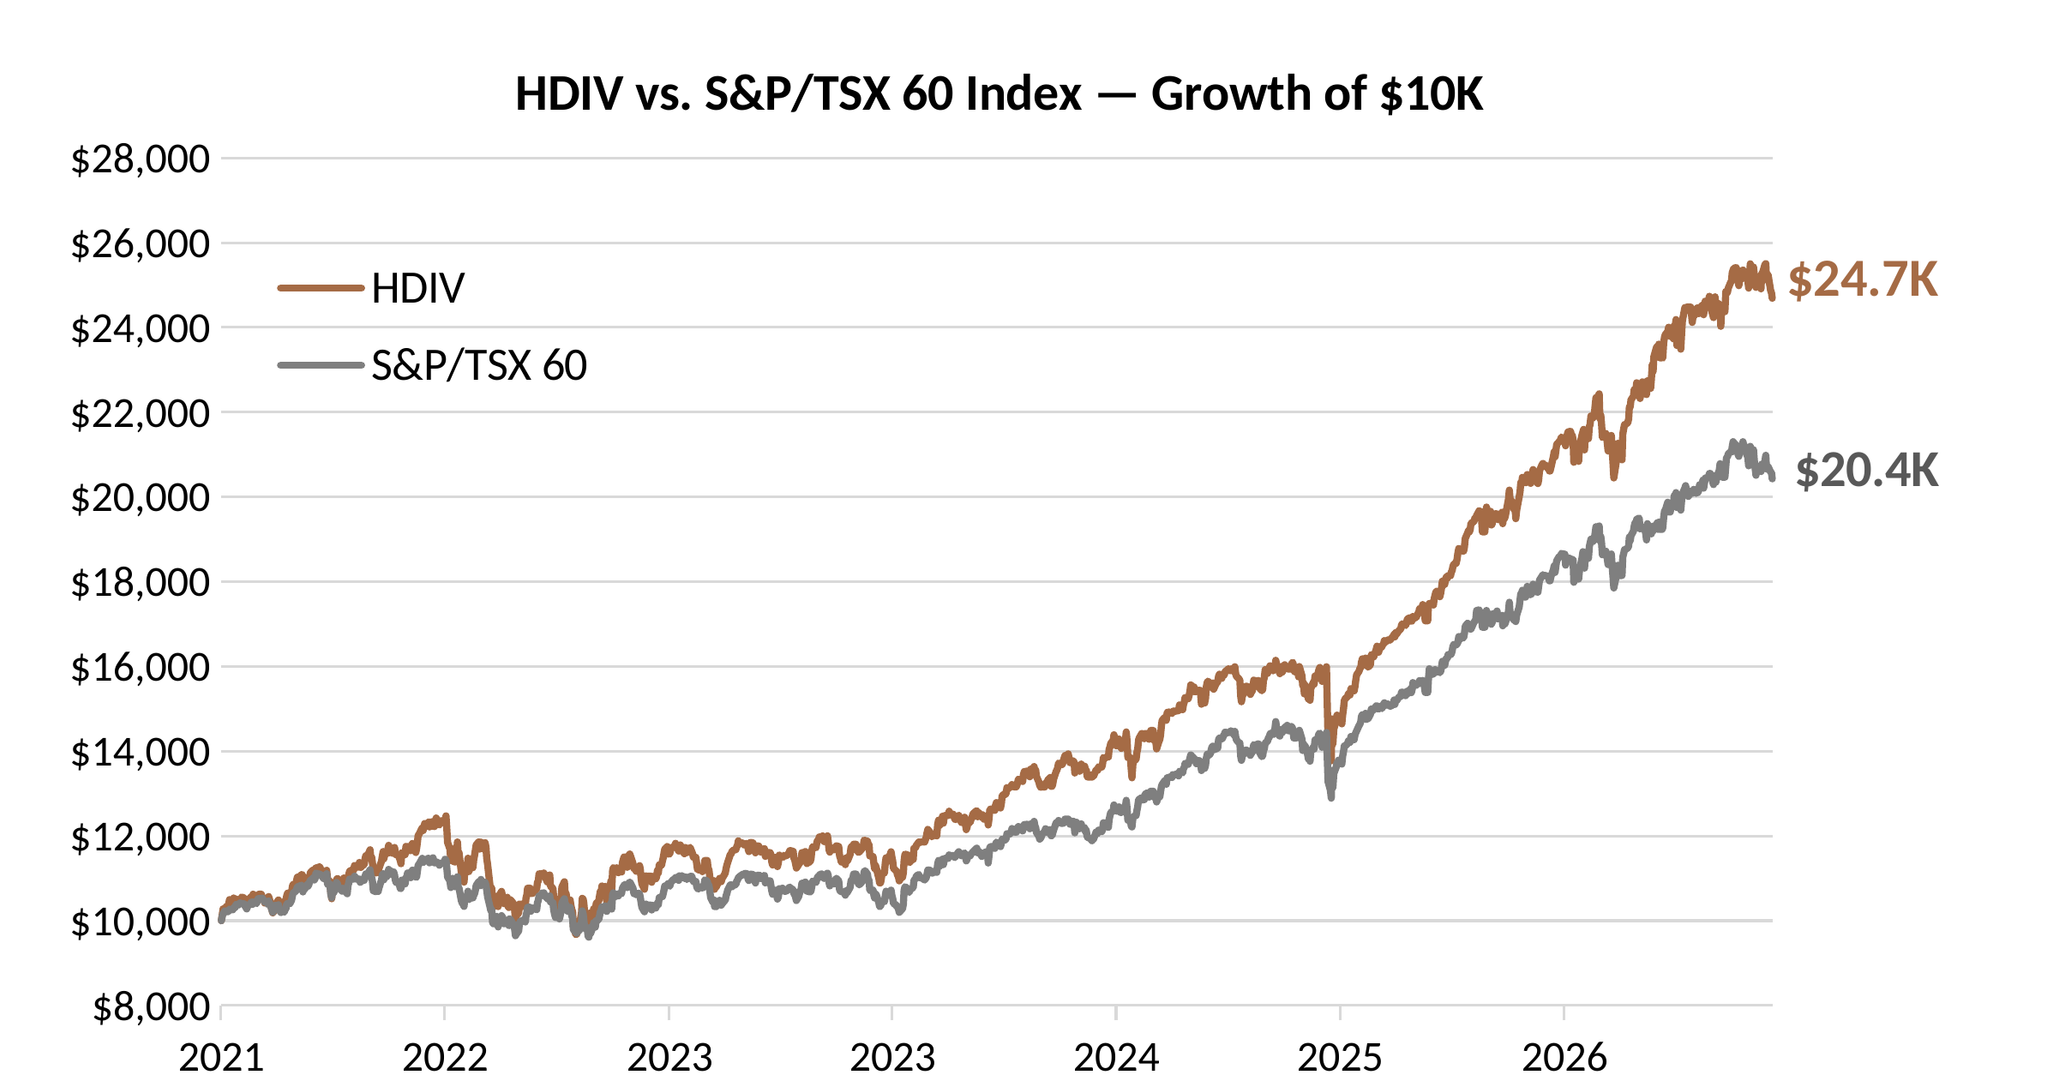
As at September 30, 2026. Source: Bloomberg, Hamilton ETFs
The graph illustrates the impact to an initial investment of $10,000. It is not intended to reflect future returns on investments in HDIV. The S&P/TSX 60 Index performance returns are for illustrative purposes only, and the returns do not reflect any management fees, transaction costs or expenses. Investors cannot invest directly in an index.

As at September 30, 2026. Source: Hamilton ETFs
*Annualized

As at September 30, 2026. Source: Hamilton ETFs
HDIV's launch also preceded substantial growth in Canada's market for modestly leveraged covered call ETFs. ETFs using variations of this strategy can now be found across U.S. and international equities, as well as more targeted sector exposures such as technology, banks, and oil and gas.
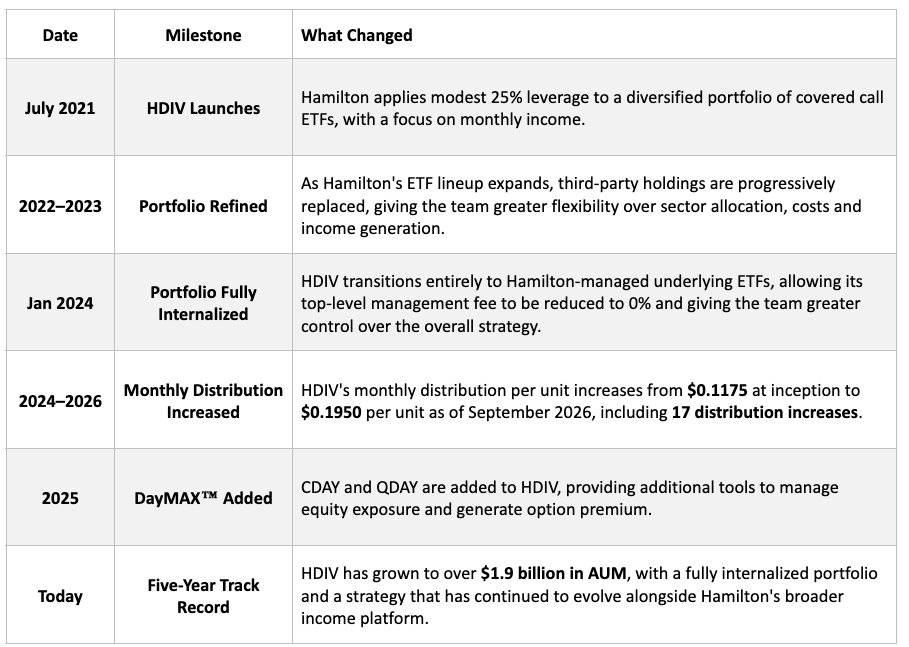
Newer investors, however, may not be familiar with how much HDIV itself has changed along the way. The ETF that has grown to over $1.9 billion in assets under management (AUM)² today has undergone several changes to its portfolio since 2021.
With HDIV passing its five-year anniversary, this is a useful opportunity to revisit that history, examine the changes made along the way and look at how Hamilton ETFs’ flagship monthly income strategy has evolved since its launch date.
Growing Pains and Finding Its Footing
HDIV's current portfolio is completely internalized, but that wasn't always the case. When the ETF was still relatively new, Hamilton had to rely on covered call ETFs from other Canadian issuers to assemble the desired sector exposures. The Hamilton team therefore spent HDIV's early years incrementally refining the portfolio with an eye toward yield, fees and diversification.
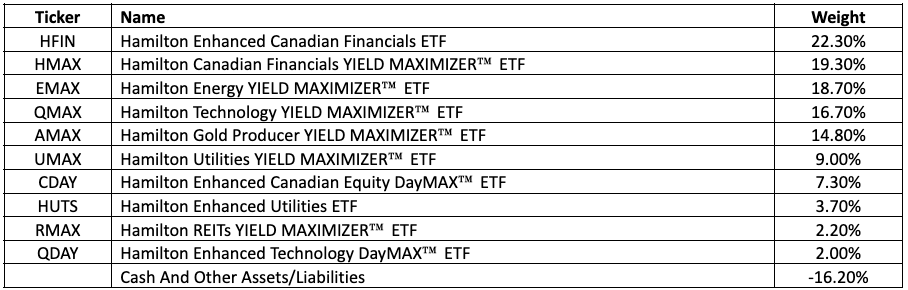
As at September 30, 2026. Source: Hamilton ETFs
Hamilton began replacing the third-party ETFs in HDIV as they launched suitable products within its own lineup. One notable example on November 2, 2022, was replacing an external holding with the Hamilton Enhanced Canadian Financials ETF (HFIN), eliminating the costs associated with owning the third-party ETF.
A subsequent change followed on February 10, 2023, when HDIV replaced another third-party ETF with the Hamilton Canadian Financials YIELD MAXIMIZER™ ETF (HMAX). HMAX broadened the financial allocation beyond a pure Canadian bank portfolio. The switch also reflected HDIV's income objective.
These changes were only the beginning of HDIV’s evolution. The next step was finding a way to bring the portfolio completely under the Hamilton banner, reducing its reliance on third-party ETFs and giving the portfolio management team greater control over the exposures, costs and covered call strategies used inside HDIV.
HDIV’s 2024 Banner Year
A major step in HDIV’s evolution came on January 29, 2024, when Hamilton reduced the ETF’s top-level management fee to 0%. The change was made possible by completing the internalization of HDIV’s portfolio, bringing all of its underlying ETF holdings within the Hamilton lineup.
Before the change, roughly one-third of HDIV was invested in third-party ETFs. For HDIV’s fund-of-funds structure, the fees and expenses charged by those acquired funds were passed through. By replacing the remaining third-party holdings with Hamilton-managed ETFs, Hamilton could eliminate HDIV’s top-level management fee and thus reduce overall fees paid by investors.
Now, that didn’t make HDIV itself cost-free. Investors remain indirectly exposed to the management fees and operating expenses of the Hamilton ETFs held within the portfolio, along with borrowing costs associated with HDIV’s use of modest 25% leverage. But eliminating the additional management fee at the HDIV level simplified the fund structure and reduced a layer of costs.
Hamilton paired the internalization with another positive change for income-focused investors. HDIV’s monthly distribution was increased by approximately 7%, from $0.141 per unit to $0.151 per unit. It wouldn't be the last distribution increase though.
But the January 2024 distribution increase was particularly notable because it coincided with the completion of the portfolio’s internalization, marking the point when HDIV became the fully Hamilton-managed fund-of-funds structure investors know today.
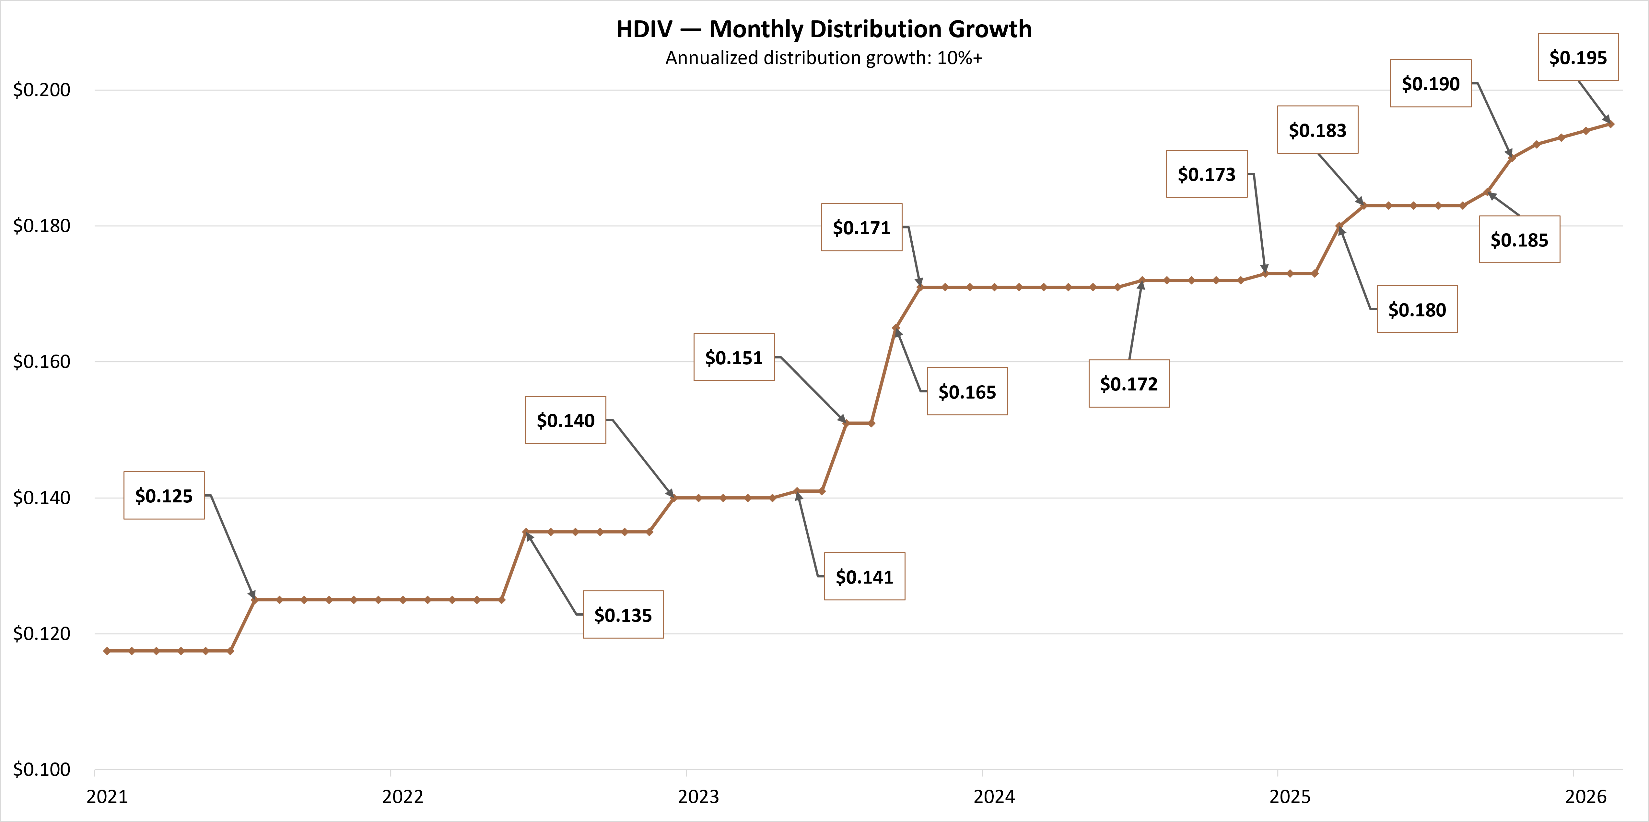
As at September 30, 2026. Source: Hamilton ETFs
Distributions are subject to change and/or elimination
Adding 0DTE Covered Call ETFs
HDIV's active mandate gives Hamilton ETFs flexibility to look outside the domestic market when a particular sector isn't adequately represented. For example, Canada’s technology sector is considerably narrower and has poorer liquidity versus the U.S. market.
Selective U.S. exposure therefore gives HDIV access to a much deeper technology market and more liquid options chains from which to collect premiums. That flexibility helps explain some of the sector overweights and underweights investors see when comparing HDIV with the S&P/TSX 60 Index.
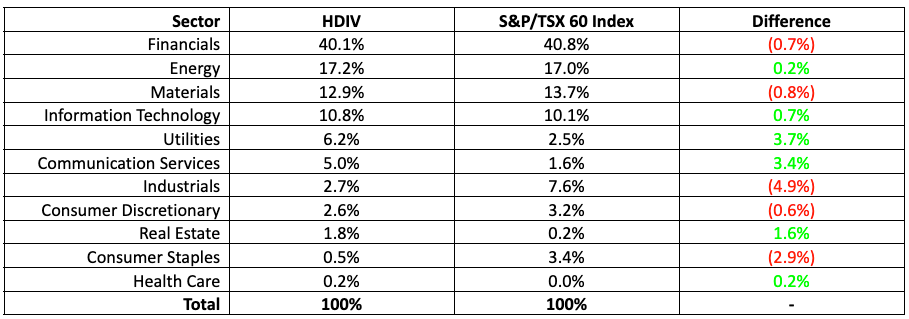
As at September 30, 2026. Source: S&P Global, Hamilton ETFs
Another development provided Hamilton with additional tools for refining those exposures. The firm introduced its DayMAX™ lineup in June 2026. These ETFs combine long equity portfolios with zero-days-to-expiry (0DTE) options strategies. The strategy retains overnight equity exposure for potential market appreciation while systematically harvesting option premiums during the trading day.
Thus, Hamilton made another round of changes to HDIV on September 30, 2025 by adding select DayMAX™ ETFs. This continued the same process that had shaped HDIV since its early years: using new products to refine its sector exposure and potentially enhance income generation.
Things to Know
No strategy is without trade-offs. HDIV’s modest use of leverage can magnify both gains and losses, while covered calls can limit some upside during strong rallies. However, HDIV obtains its leverage using institutional borrowing rates, which are generally more favourable than the margin rates available to individual investors seeking to replicate the same exposure themselves. HDIV’s monthly distribution has also increased substantially since inception, although distributions are not guaranteed and may change.
Cost remains another consideration. Although HDIV carries a 0% management fee at the fund level, investors remain indirectly exposed to the expenses of the underlying Hamilton ETFs and the variable borrowing costs associated with leverage. Together, these contribute to HDIV’s reported expenses. That said, the fund’s published performance and yield figures are already presented on a net basis, meaning the results investors see reflect these costs rather than requiring them to be deducted again.
Five Years of Evolution
So far, HDIV has delivered on its objectives. As of September 30, 2026, its annualized figures demonstrate outperformance relative to the S&P/TSX 60 Index over multiple periods. Meanwhile, based on its most recent monthly distribution, HDIV offered an annualized yield of 10.13%³.
HDIV’s growth has also occurred alongside the broader expansion of Hamilton ETFs. Today, Hamilton is Canada’s largest independent ETF provider, with more than $18 billion in AUM across a growing lineup of income and growth solutions. HDIV has been an important part of that evolution.
Five years later, HDIV has matured from a novel approach to Canadian covered call investing into one of Hamilton’s largest income ETFs. Its combination of diversified sector exposure, active options management, modest leverage, and high yield has also helped broaden the choices available to Canadian investors seeking income-first equity strategies.
¹An estimate of the annualized yield an investor would receive if the most recent distribution remained unchanged for the next 12 months, stated as a percentage of the price per unit on September 30, 2026. The yield calculation excludes any additional year end distributions and does not include reinvested distributions.
²As at September 30, 2026. Source: Hamilton ETFs
³An estimate of the annualized yield an investor would receive if the most recent distribution remained unchanged for the next 12 months, stated as a percentage of the price per unit on September 30, 2026. The yield calculation excludes any additional year end distributions and does not include reinvested distributions.