Invesco S&P 500 High Dividend Low Volatility ETF (SPHD) Review
Last Updated:

Investors approaching or entering retirement often ask the same question: how can they reduce portfolio risk while still generating enough income to fund withdrawals?
My answer is usually fairly straightforward. Hold an appropriate allocation to high-quality bonds and cash for stability, then periodically sell appreciated assets to generate the cash you need. That's generally one of the most tax-efficient and flexible approaches.
Unfortunately, many retirees dislike selling shares, even when it's the most rational choice. Instead, they're often drawn toward increasingly sophisticated income strategies involving options collars, buffered equity products, and other derivative-heavy approaches.
My response is usually that if you're willing to accept additional complexity and higher fees in exchange for smoother cash flows, an annuity is at least designed specifically for that purpose.
There is another option, though. The Invesco S&P 500 High Dividend Low Volatility ETF (SPHD) has attracted approximately $3.4 billion in assets under management by promising exactly what many retirees are looking for: above-average dividend income paired with below-average volatility.
The concept is appealing, and I find many investors buy SPHD based largely on its name, assuming it will naturally deliver both objectives. After digging into the methodology, however, I think the strategy is considerably less effective than the marketing suggests. Here's my review of SPHD in 2026.
SPHD: What I Like
SPHD’s methodology first screens the S&P 500 for the highest-yielding companies before selecting the 50 stocks with the lowest trailing 12-month volatility from that universe. That ordering is important. High dividend yield comes first, while low volatility is applied only after narrowing the investment universe.
The resulting portfolio is weighted by dividend yield, with individual positions capped at 3%. Sector exposure is limited to a maximum of 10 companies and no more than 25% of portfolio weight. The index is reconstituted and rebalanced semi-annually in January and July.
Not surprisingly, this process produces a portfolio that looks very different from the capitalization-weighted S&P 500. Technology is no longer the dominant sector.
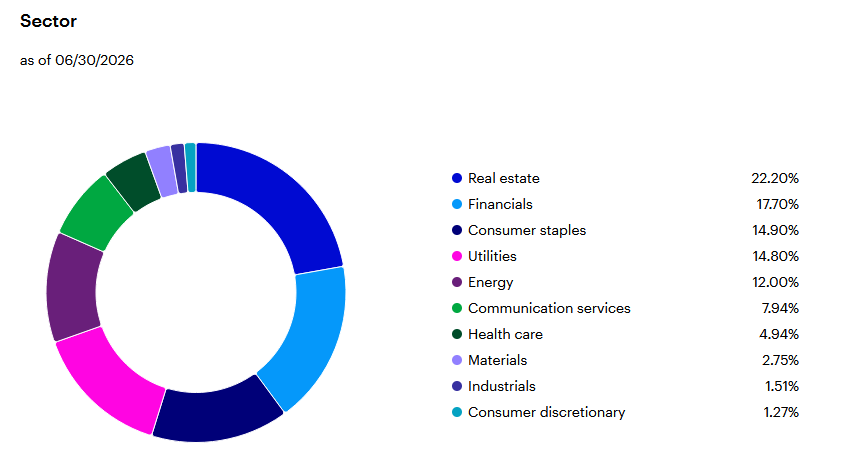
Source: Invesco
The strategy also accomplishes one of its primary objectives: generating income. SPHD currently offers a 4.25% 30-day SEC yield, roughly four times that of a traditional S&P 500 ETF. That's after accounting for its 0.30% expense ratio, which is fairly typical for a smart-beta strategy.
The high-dividend screen also creates a meaningful value tilt. The portfolio currently trades at a forward price-to-earnings ratio of just 13.57, roughly half that of the broader S&P 500. Investors who prefer receiving cash flow throughout the year may also appreciate that the ETF pays distributions monthly.
SPHD: What I Don't Like
SPHD hasn't reduced risk nearly as much as investors might expect. Over a 13.74 years from October 2012 through July 2026 versus the SPDR S&P 500 ETF Trust (SPY), maximum drawdown was deeper, annualized volatility was comparable, and the ETF has weaker risk-adjusted returns.
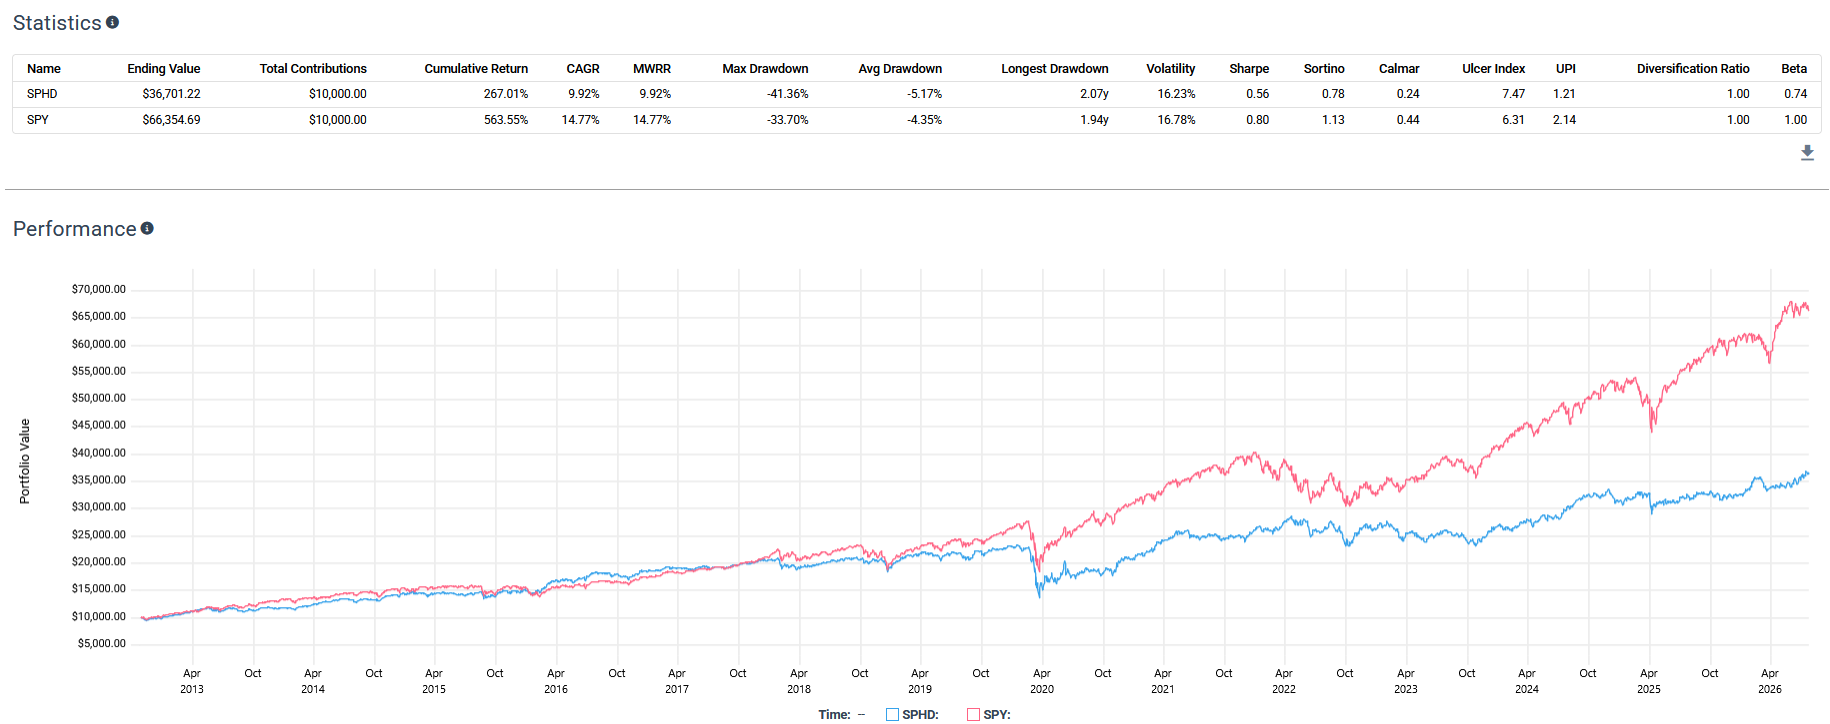
Source: Testfolio
Part of the issue is the index methodology itself. Historical volatility is inherently backward-looking. Stocks that have been stable over the previous 12 months aren't guaranteed to remain stable during the next market correction (correlations tend to go to 1 in a crash).
At the same time, limiting the portfolio to only 50 stocks creates substantial concentration risk. The sector limits also aren't particularly restrictive. Allowing up to 25% in a single sector still permits large bets on industries that happen to screen well at a given point in time.
I also question the order of the screening process. Starting with the highest-yielding stocks and only then filtering for lower volatility narrows the opportunity set considerably. Many of the highest-yielding companies already have significant cyclical and industry-specific risks.
Interestingly, a simple 50/50 portfolio consisting of the Invesco S&P 500 Low Volatility ETF (SPLV) and the State Street SPDR Portfolio S&P 500 High Dividend ETF (SPYD), rebalanced quarterly produced better results than SPHD alone.
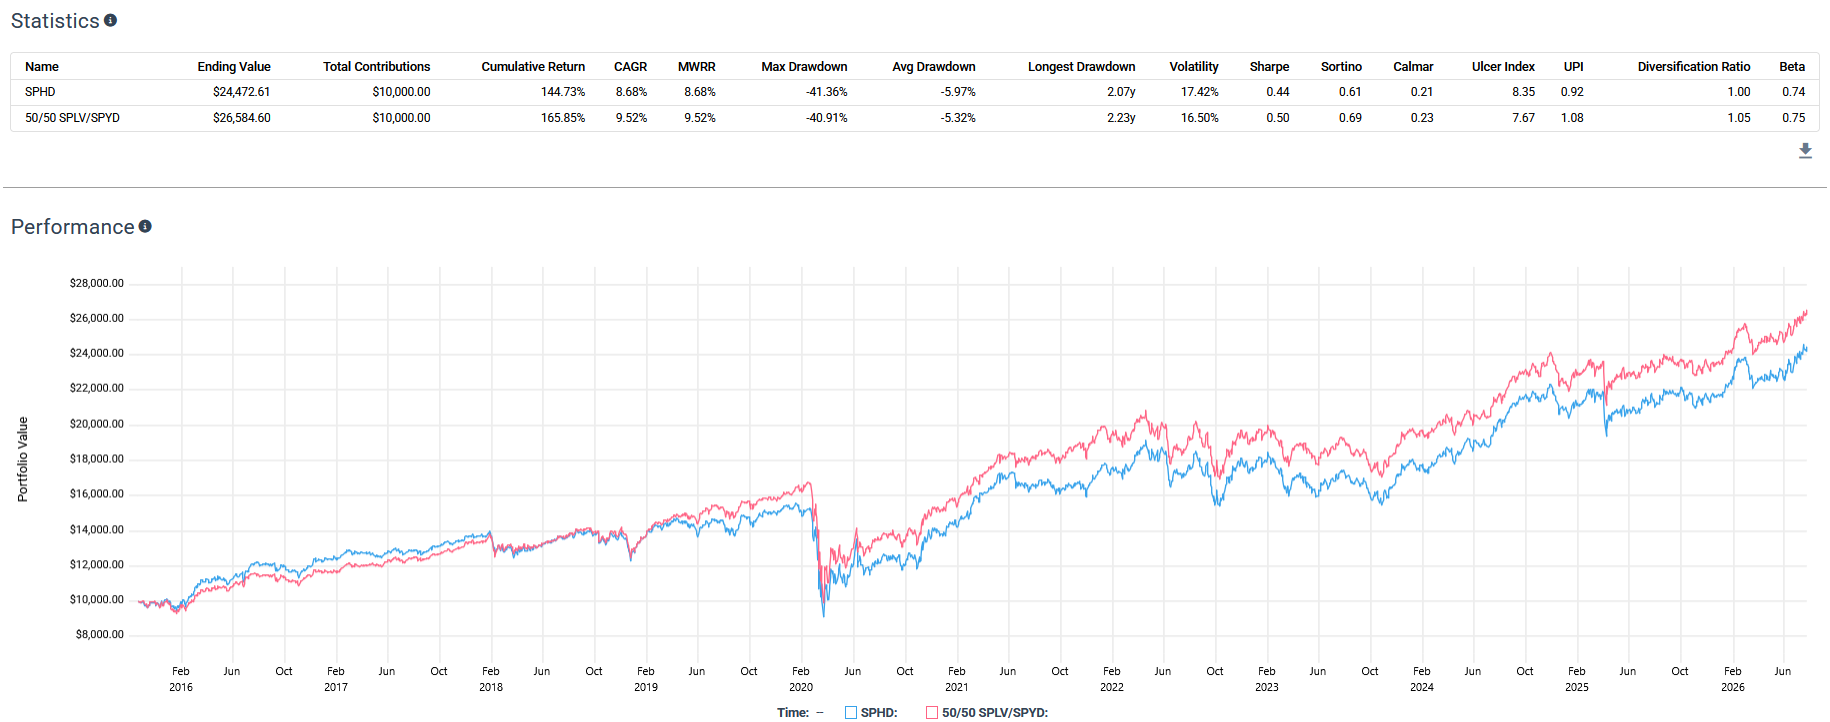
That combination generated higher returns while experiencing slightly lower drawdowns and annualized volatility, a similar beta, and superior risk-adjusted performance. To me, that's evidence that the idea behind SPHD is sound, but the implementation leaves room for improvement.
SPHD: My Verdict.
Overall, I’d give SPHD a 6/10. The concept is easy to appreciate. Many retirees genuinely want a portfolio that produces above-average income without exposing them to the full volatility of the broader equity market. Unfortunately, I don't think the index delivers on that promise as effectively as it could.
The fund certainly provides an attractive monthly income stream, a meaningful value tilt, and lower headline beta than the S&P 500. Those are legitimate strengths. But the trade-offs are difficult to ignore.
The portfolio is concentrated, relatively tax inefficient, heavily exposed to a handful of sectors, and relies on a backward-looking volatility screen that hasn't translated into meaningfully better downside protection. Perhaps most importantly, there are relatively straightforward ways to combine existing ETFs that have historically delivered better risk-adjusted results.
In short, SPHD has a compelling premise, but I think investors can build a more effective high-income, lower-volatility portfolio using better-designed ETFs.