
Peerless Option Income Wheel ETF (WEEL) Review
Last Updated:

When it comes to derivative income ETFs, covered call strategies are easily the most common. More sophisticated approaches involving structured products such as equity-linked notes (ELNs) and autocallables have also become increasingly prevalent in recent years.
Cash-secured put strategies are less common, while ETFs that systematically combine cash-secured puts with covered calls remain rarer still. Retail traders, however, have been using this combination for years. Spend time on Reddit’s r/thetagang community and you will encounter a strategy known as the “Wheel.”
The process typically begins by selecting a stock or ETF you would be comfortable owning and selling a cash-secured put against it. The investor collects an option premium, and if the put expires out of the money, the process can simply be repeated.
If the put finishes in the money and the investor is assigned shares, the strategy moves to its second stage. The investor begins selling covered calls against those shares, collecting additional premiums until the stock is eventually called away. Rinse and repeat.
Like many strategies that gained popularity among self-directed investors, the Wheel has now been packaged into an ETF. The Peerless Option Income Wheel ETF (WEEL) was the first ETF designed around this approach, debuting on May 16, 2024. It currently has $42.77 million in assets under management.
That makes the fund interesting from a strategy perspective, but it also raises the more practical question of whether outsourcing the Wheel to an ETF provides enough value to justify its cost. Here is what I like and dislike about WEEL, and whether I think this unusual income ETF is worth considering.
WEEL: What I Like
What I like most about WEEL is that it is a genuinely systematic strategy rather than another variation on a standard index covered call ETF. The strategy occupies an interesting middle ground between downside-oriented options strategies and traditional covered call funds.
Rather than beginning with a long equity portfolio and immediately selling away some of its upside, WEEL generally enters positions by selling short-dated, out-of-the-money cash-secured puts. If those puts are assigned, WEEL takes ownership of the underlying security and transitions into selling covered calls against it. Premiums can then be harvested repeatedly until the shares are eventually called away.
This can be particularly useful when valuations are elevated and an investor would rather get paid to potentially enter a position at a lower price. It also gives WEEL opportunities to generate returns that are less dependent on markets continuously moving higher.
The strategy's ideal environment is generally a range-bound or moderately rising market where both puts and calls can repeatedly expire without large directional moves. Peerless notes that between 1925 and 2000, the S&P 500 produced calendar-year returns between an 8% loss and a 15% gain approximately 32% of the time, illustrating how frequently markets have historically landed within a relatively moderate range.
Another feature I like is that WEEL does not confine itself to options on a handful of major indexes such as the S&P 500, Nasdaq-100 or Russell 2000. The managers can move across sector, industry and thematic ETFs, focusing on underlying assets with sufficiently robust options markets. That means looking for adequate open interest, multiple expiration dates and enough available strike prices.
The resulting opportunity set can be unusually diverse for an options income ETF. Recent positions have provided exposure to areas including the Nasdaq-100, semiconductors, regional banks, utilities, industrials, Chinese internet stocks, homebuilders, silver, short-term VIX futures, China A-shares, gold miners and emerging markets. The underlying exposures can therefore change considerably as the managers identify attractive option premiums and potential entry points.
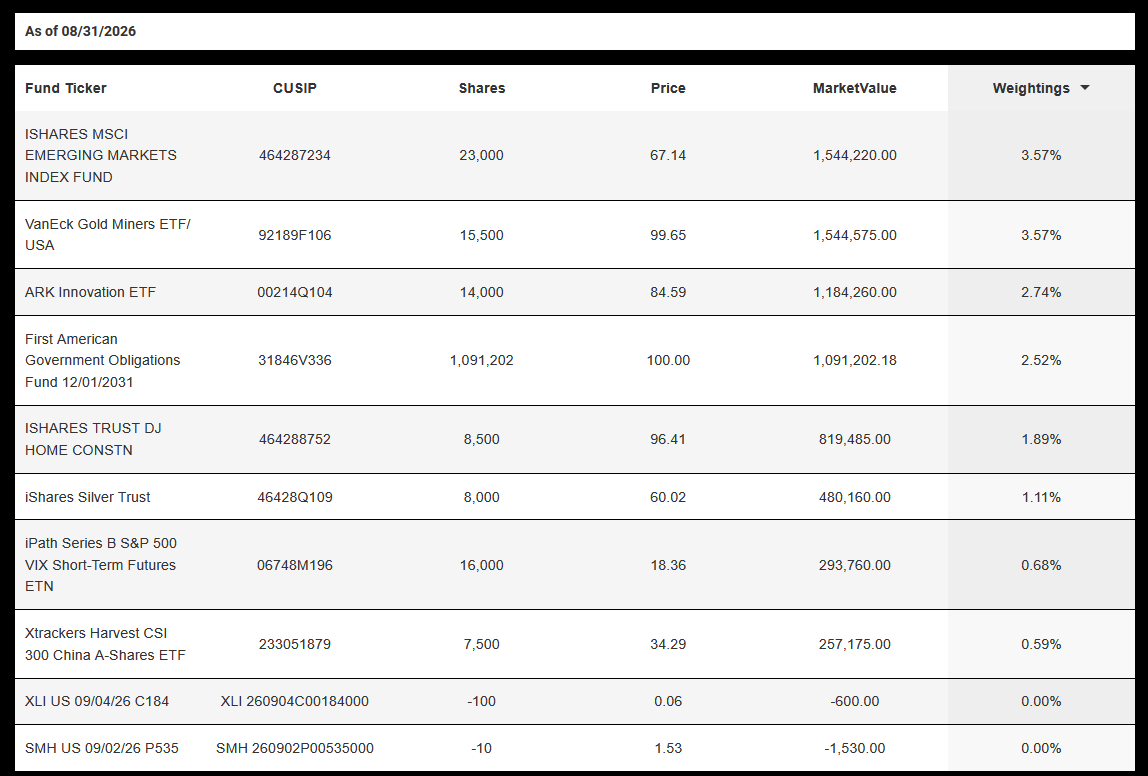
Source: Peerless ETFs
The early results have also been encouraging. According to Testfol.io, over the approximately 2.28 years from WEEL's inception through August 28, 2026, WEEL produced a higher annualized return than the much larger JPMorgan Equity Premium Income ETF (JEPI). WEEL did so with somewhat higher volatility, but with a better risk-adjusted return. Its Sharpe ratio was 0.75 compared with 0.45 for JEPI.
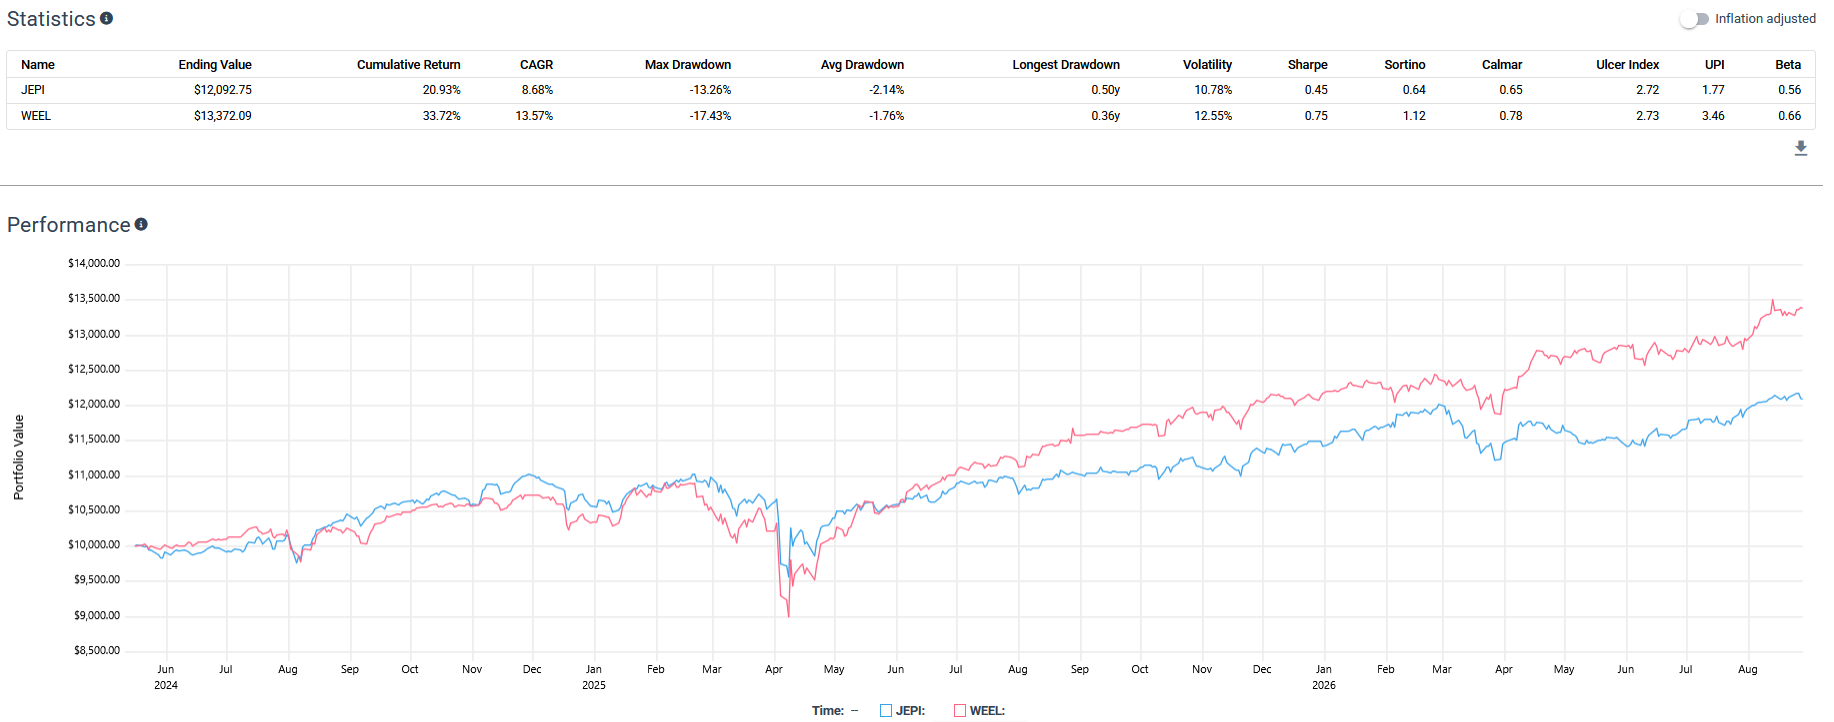
Source: Testfolio
Income has also been higher. Based on the latest distribution annualized against net asset value, WEEL currently has an 11.86% distribution rate compared with 7.94% for JEPI. Of course, distribution rates can change and should not be confused with total return or portfolio yield, but investors specifically seeking cash flow have so far received considerably more from WEEL.
WEEL: What I Don't Like
No ETF is perfect, and WEEL's clearest weakness is cost. The fund carries a 1.24% gross expense ratio, consisting of a 1.09% management fee plus another 0.15% in acquired fund fees and expenses. A 0.25% fee waiver currently brings the net expense ratio down to 0.99%.
I understand some of the economics here. WEEL remains a relatively small ETF, and implementing and actively managing numerous options positions requires considerably more work than tracking an index. If assets under management continue growing, there may eventually be room for further fee reductions.
From an investor's perspective, however, I think a net expense ratio somewhere around 0.75% to 0.85% would make the value proposition considerably more attractive. At 0.99%, the strategy has a fairly fee drag to overcome every year, especially compared to JEPI which charges 0.35%.
Trading liquidity is another weakness. WEEL currently has a 30-day median bid-ask spread of approximately 0.39%, which adds another potential cost when entering or exiting the ETF. A 0.39% spread makes limit orders particularly important. For long-term holders who trade infrequently, the impact should be less significant than it would be for someone regularly moving in and out of the fund.
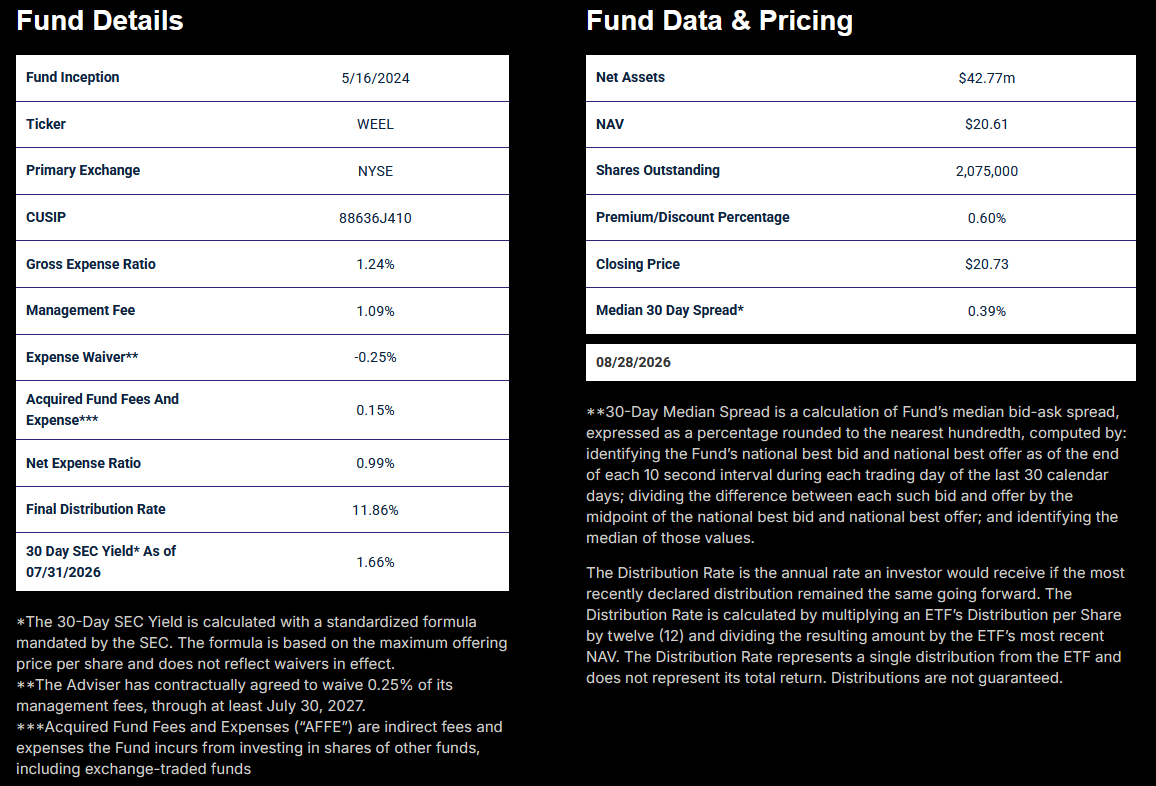
Source: Peerless ETFs
Finally, WEEL pays distributions quarterly rather than monthly, which may disappoint investors accustomed to monthly payouts from derivative income ETFs. Personally, after speaking with portfolio manager Robert Pascarella, however, this particular feature doesn't bother me much.
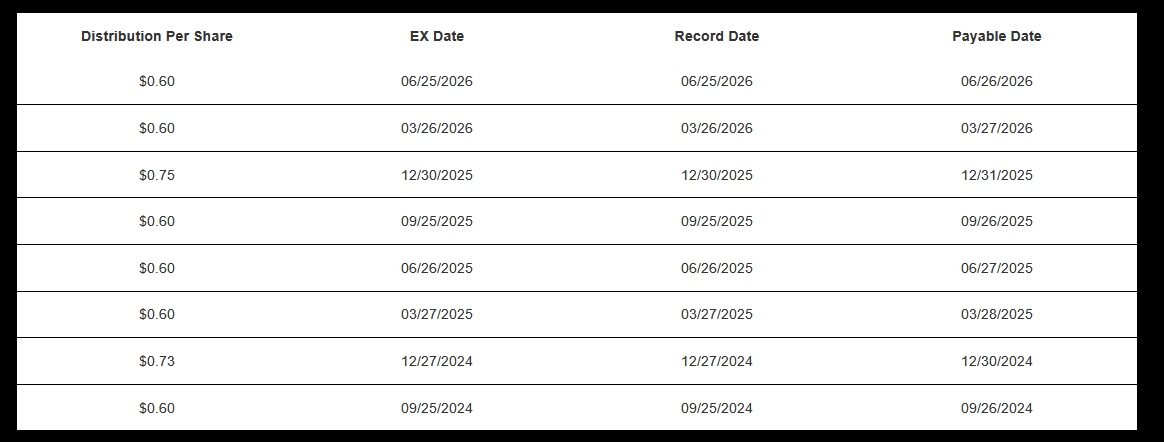
Source: Peerless ETFs
A less frequent distribution schedule gives the managers greater flexibility to retain and redeploy option premiums rather than managing the portfolio around the need to generate cash for a predetermined monthly payout. That makes sense from a portfolio-management perspective, even if some income-oriented investors would still prefer monthly cash flow.
WEEL: My Verdict
WEEL gets a 7/10 from me. Its biggest strength is that it is actually doing something different. Rather than launching another covered call ETF against a familiar benchmark, Peerless was first to package the full Wheel strategy into an ETF, systematically moving between cash-secured puts, assigned equity positions and covered calls across a broad opportunity set.
The limited track record has been promising as well. Since inception, WEEL has compared favourably with a prominent derivative income strategy such as JEPI on both absolute and risk-adjusted returns, while also generating a substantially higher distribution rate. I particularly like its flexibility to search across sectors, industries and asset classes instead of relying on a single equity index.
What keeps it from scoring higher are the practical costs of accessing that strategy. A 0.99% net expense ratio is high, and the 0.39% median bid-ask spread adds another layer of friction. The quarterly distribution schedule may also make it less appealing to investors specifically seeking predictable monthly cash flow, although I think the rationale behind that decision is reasonable.
For investors who understand options and specifically want to outsource a Wheel strategy, WEEL is one of the more interesting derivative income ETFs I've encountered. The strategy itself has earned my attention, but lower expense ratio and better secondary-market liquidity would make the overall package considerably easier to recommend.