
How to Use ETF Overlap to Your Advantage as a Stock Picker
Last Updated:

One thing I frequently notice when investors post their ETF portfolios on Reddit is the sheer amount of overlap, particularly among large-cap U.S. stocks. Someone might own five or six ETFs and assume they're well diversified, only to discover that the same handful of mega-cap companies appears.
I think this reflects something retail investors sometimes struggle with when using ETFs: treating each fund as a cohesive component of an overall portfolio rather than assembling a collection of standalone investment ideas. Advisors aren't necessarily immune, either. After talking with fee-only advisors, I've heard a few stories about new clients arriving with Frankenstein portfolios containing dozens of funds.
There are legitimate reasons to own similar ETFs. Tax-loss harvesting is one example, since an investor may sell one fund at a loss and replace it with another providing similar, but not substantially identical, exposure. Beyond cases like that, excessive overlap can create unnecessary complexity without providing much additional diversification.
But what if you're a stock picker rather than an ETF investor? In that case, ETF overlap can actually become a useful screening tool. The key is understanding the methodologies behind passive ETFs.
An index fund’s underlying benchmark generally has explicit rules determining which companies qualify and how they're weighted. Compare the holdings of two ETFs with different selection criteria, and the stocks appearing in both have effectively passed two independent screens.
That turns overlap into a process of elimination. Instead of building a complicated stock screener yourself, you can piggyback on the work already performed by index providers and identify companies satisfying multiple characteristics simultaneously.
To demonstrate, I'm going to use the ETF overlap tool from ETF Research Center and approach the exercise from the perspective of a defensively minded, income-oriented stock picker.
NOBL and SPLV: Combining Dividend Growth with Low Volatility
For a simple example, consider the ProShares S&P 500 Dividend Aristocrats ETF (NOBL) and the Invesco S&P 500 Low Volatility ETF (SPLV).
NOBL's methodology is straightforward. It selects companies from the S&P 500 that have increased their dividends for at least 25 consecutive years and generally equal weights the qualifying stocks. That gives us our first screen: long-term dividend growth.
SPLV approaches the same S&P 500 universe from an entirely different direction. It selects the 100 stocks with the lowest realized volatility over the preceding 12 months and weights them according to realized volatility, with the least volatile stocks receiving the largest allocations. That gives us our second screen: relatively defensive recent price behavior.
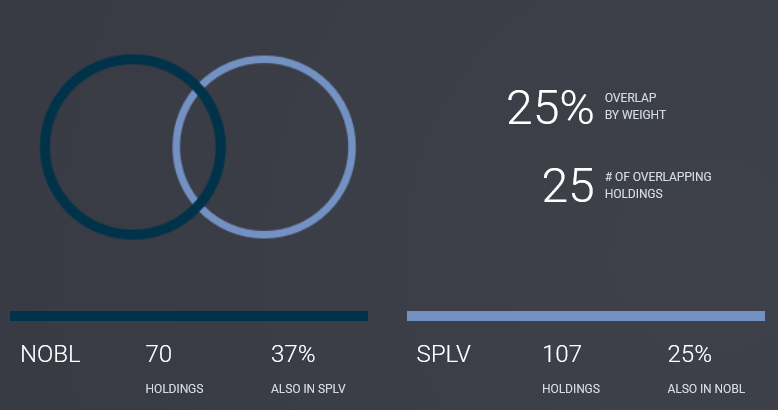
Once you understand those methodologies, the overlap becomes much more informative. Running NOBL against SPLV through ETF Research Center identifies companies that have both increased their dividends for at least 25 consecutive years and ranked among the S&P 500's least volatile stocks based on the methodology's lookback period.
Source: ETF Research Center
According to the overlap screen, 25 stocks currently appear in both portfolios. That doesn't automatically make any of them a buy. Valuation, balance-sheet quality, earnings growth, payout sustainability and company-specific risks still require analysis.

Source: ETF Research Center
What the overlap does is reduce the initial universe. Instead of manually screening hundreds of S&P 500 companies for defensive characteristics and dividend consistency, two established index methodologies have already done much of the preliminary work.
Build Your Own Multi-Factor Screens
NOBL and SPLV are only one example. With thousands of index ETFs now available, stock pickers can find methodologies corresponding to an enormous range of characteristics and then look for companies appearing at their intersection.
That's where I think ETF overlap becomes particularly useful. Many index methodologies are deliberately one-dimensional. One might target dividends, another quality, another momentum, and another value. Combining their holdings lets a stock picker construct an informal multi-factor screen without having to source and normalize all the underlying financial and market data independently.
As an ETF guy, I actually prefer this as a starting point to arbitrarily plugging criteria into a stock screener. Established index providers have already done much of the tedious work of sourcing reliable data, defining variables, establishing eligibility requirements, ranking securities and periodically reconstituting the resulting portfolios.
ETF overlap doesn't replace fundamental analysis, and inclusion in several ETFs certainly doesn't mean a stock is attractive at its current valuation. But as a process-of-elimination tool, it can turn something ETF investors usually regard as a portfolio construction problem into a useful resource for stock pickers.