Build Your Own Hedge Fund Portfolio with These 3 Alternative ETFs
Last Updated:

Have you ever wanted to invest like a hedge fund manager without paying the traditional 2-and-20 fee structure, meeting accredited or qualified investor requirements, or having your money tied up behind lockup periods and redemption gates?
Recently, I wrote an article for U.S. News & World Report on how to invest in hedge funds. One section explored publicly accessible replacements for hedge fund investments. You might have encountered these products under names such as hedge fund replication strategies or liquid alternatives.
There's an entire universe of ETFs attempting to deliver returns similar to those historically associated with hedge funds, using strategies that go well beyond buying and holding stocks and bonds. Depending on the fund, these can involve long and short positions, derivatives, trend following, tactical asset allocation and bets on macroeconomic developments.
Traditionally, access to these strategies has often come with substantial barriers. The classic hedge fund fee arrangement involves a 2% annual management fee and a 20% performance fee, although actual fee structures vary considerably. Investors may also face minimum investment requirements, eligibility restrictions, multiyear lockups and limitations on when they can withdraw their capital.
ETFs remove many of those practical obstacles. They generally offer intraday liquidity, daily portfolio holdings disclosure and substantially lower expense ratios, with no requirement to qualify as an accredited investor. You can also get started for the price of a single share, or potentially less if your brokerage supports fractional-share trading.
Of course, an ETF wrapper doesn't guarantee hedge fund-like returns or eliminate the risks associated with leverage, derivatives and unconventional investment strategies. Nor can every hedge fund approach be replicated effectively in a liquid, publicly traded vehicle.
But I think there's an interesting opportunity to borrow another concept from the hedge fund industry: the fund of funds. A traditional hedge fund of funds allocates capital among multiple managers and strategies, seeking to diversify its sources of return rather than depend on a single investment approach.
We can construct a simplified version of that idea using ETFs, without adding another layer of fund-of-funds management fees. Today, I'm going to build a hypothetical, equal-weighted three-ETF hedge fund portfolio with one allocation each to a long-only strategy, managed futures and global macro.
Goldman Sachs Hedge Industry VIP ETF (GVIP)
Contrary to what the name might suggest, hedge funds aren't necessarily focused on risk management. A substantial portion of the industry attempts to generate alpha through superior stock selection, identifying companies that managers believe will outperform the broader market.
These are often the funds investors follow most closely, particularly through their quarterly Form 13F filings with the Securities and Exchange Commission (SEC), which disclose certain long positions in U.S.-listed securities held by institutional investment managers.
That's essentially the strategy behind the Goldman Sachs Hedge Industry VIP ETF (GVIP). The fund analyzes 13F filings from hedge fund managers and constructs a concentrated portfolio of approximately 50 stocks that appear most frequently among their 10 largest disclosed long equity positions. The idea is to identify the high-conviction holdings that prominent hedge funds have collectively emphasized.
The implementation is fairly conventional. GVIP owns stocks outright, without employing short selling, leverage or derivatives as part of its core strategy. Investors are effectively getting a curated portfolio of popular hedge fund stock picks, rather than the full range of strategies those managers might employ.
Technically, GVIP is passively managed because it tracks a proprietary Goldman Sachs index rather than relying on discretionary stock selection by a portfolio manager. In practice, however, the methodology produces a portfolio with meaningful active share relative to conventional broad-market benchmarks. Its holdings reflect hedge fund positioning rather than market capitalization alone.
Fees are also competitive. Instead of paying the traditional 2% management fee and 20% performance fee associated with some hedge funds, GVIP charges an annual expense ratio of just 0.45%. I think that's reasonable for what the fund is attempting to accomplish.
The current portfolio is heavily tilted toward the United States, which accounts for approximately 86% of its holdings. I've included snapshots of GVIP's 10 largest positions, geographic exposure and sector allocations below. As you'll see, the holdings and geographic breakdown differ meaningfully from those of a typical global equity benchmark, while the sector allocations provide a more familiar picture.
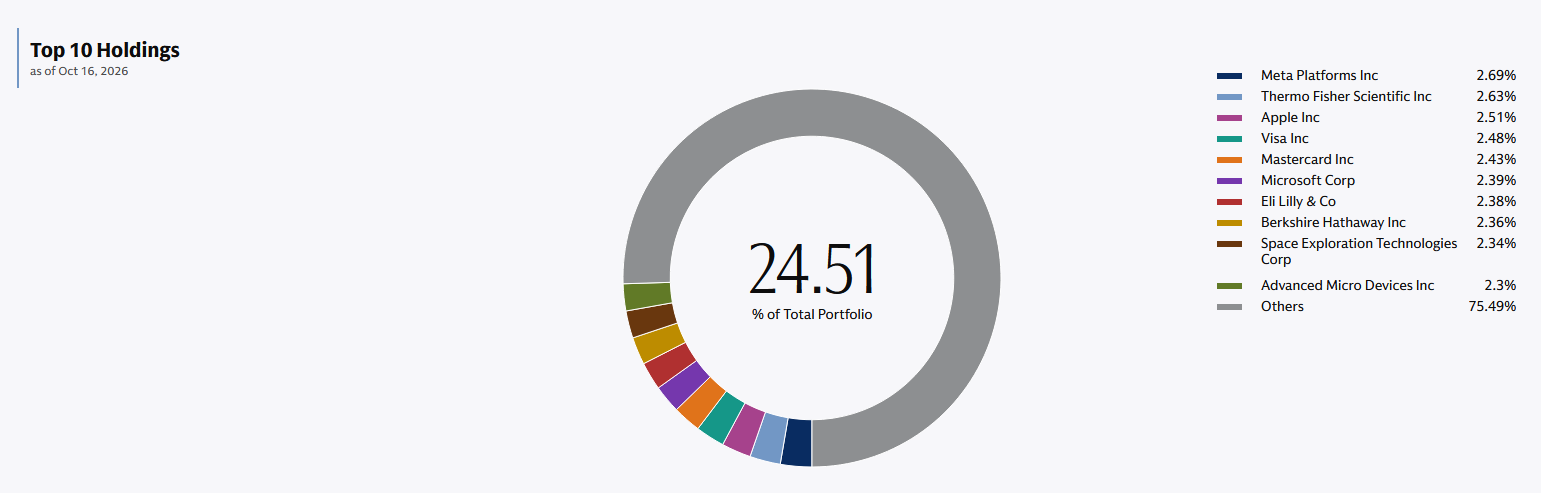
Source: Goldman Sachs
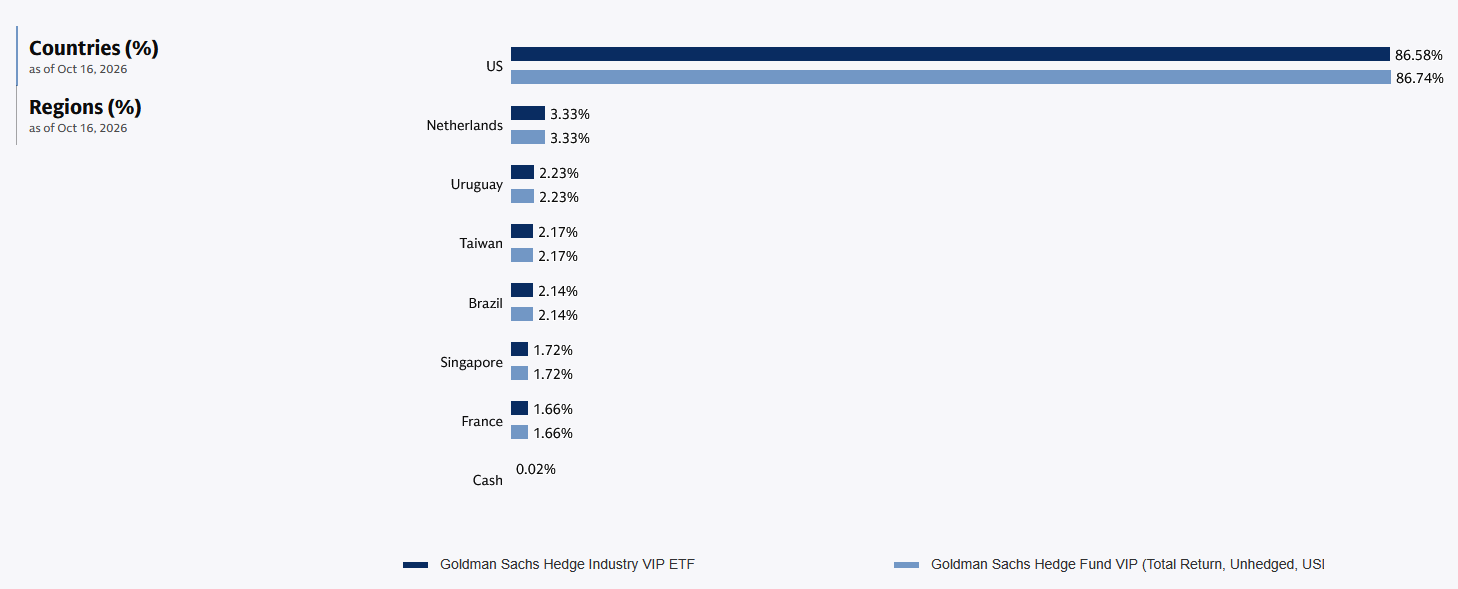
Source: Goldman Sachs
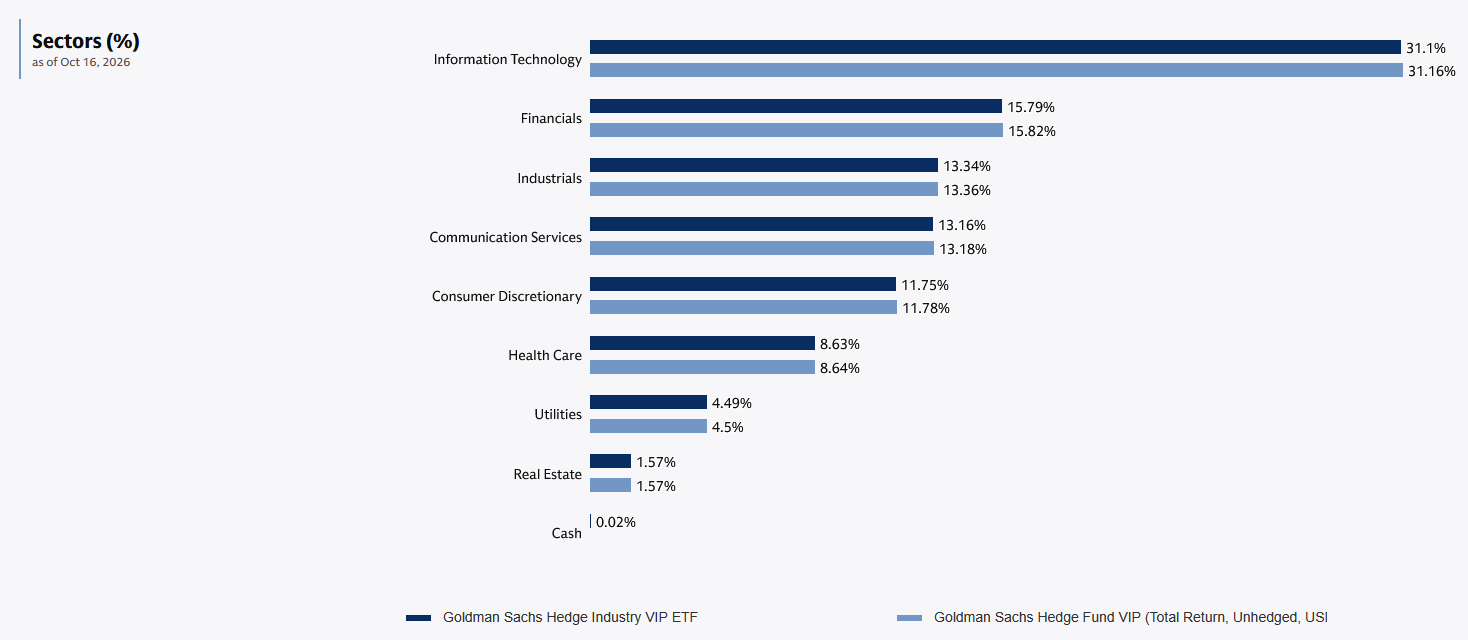
Source: Goldman Sachs
For the long-only equity sleeve of our hypothetical hedge fund portfolio, GVIP offers a relatively inexpensive way to follow the collective high-conviction stock selections of institutional managers. Just remember that 13F filings are backward-looking, can be up to 45 days old when published and reveal only part of a hedge fund's positioning.
State Street Bridgewater All Weather ETF (ALLW)
Active investment managers can generally be divided into two broad camps: top-down and bottom-up. Bottom-up managers focus on individual securities, analyzing company fundamentals, valuations and competitive advantages to identify attractive investments. Top-down managers start with the bigger picture, examining economic growth, inflation, monetary policy, interest rates and geopolitical developments before deciding where to allocate capital.
There's considerable variation within top-down investing, but one of its best-known applications is global macro. This strategy attempts to profit from changes in economic conditions across countries and asset classes, often taking positions in equities, bonds, currencies and commodities.
One of the most prominent proponents of this approach is Ray Dalio, the founder and former chief investment officer of Bridgewater Associates. In books such as Principles for Dealing with the Changing World Order, Dalio explores the long-term economic and debt cycles that influence markets, including the relationships between monetary policy, inflation, productivity and geopolitical power.
Bridgewater's famous “All Weather” strategy takes these ideas and applies them to portfolio construction. The objective is to create a diversified allocation that can withstand different economic environments without requiring investors to consistently predict which one comes next.
More specifically, the strategy considers four broad economic environments based on whether growth and inflation are rising or falling relative to expectations:
- Rising growth and rising inflation: Equities and certain commodities may benefit, while nominal bonds can struggle.
- Rising growth and falling inflation: Equities and nominal bonds may perform well as economic activity strengthens and inflationary pressure moderates.
- Falling growth and rising inflation: Commodities and inflation-linked bonds can provide diversification when stocks and nominal bonds face pressure.
- Falling growth and falling inflation: High-quality nominal government bonds have historically offered defensive characteristics as growth and inflation expectations decline.
Bridgewater has partnered with State Street Investment Management to bring a version of this institutional strategy to retail investors through the State Street Bridgewater All Weather ETF (ALLW), which charges a 0.85% expense ratio.
The fund is a multi-asset solution designed to maintain exposure across these economic environments rather than make concentrated bets on any single outcome. Its four major asset classes are global nominal bonds, inflation-linked bonds, global equities and commodities.
Importantly, ALLW uses leverage, although the implementation differs from the familiar daily-reset leveraged ETFs that attempt to deliver two or three times the daily return of a stock index. I've included a screenshot of the fund's asset allocation below. You'll notice that the percentages assigned to its four major asset classes add up to more than 100%. That's because ALLW uses derivatives, including futures and swaps, to obtain economic exposure beyond the amount of capital invested in the fund.
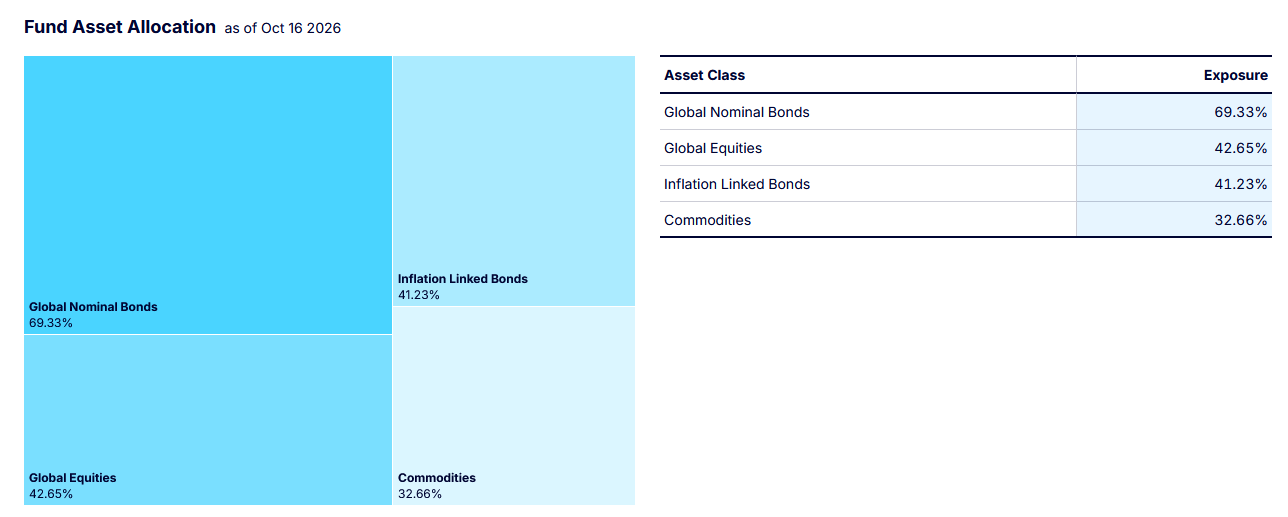
Source: State Street
These allocations aren't arbitrary. Underlying the strategy is a quantitative portfolio construction model based on risk parity. Rather than allocating equal dollar amounts to each asset class, the model seeks to balance their contributions to overall portfolio risk.
For example, equities are more volatile than bonds. A traditional portfolio with 60% equities and 40% bonds can therefore derive most of its risk from equities, despite appearing reasonably diversified by capital allocation. A risk parity approach would assign more exposure to lower-volatility assets and less to higher-volatility assets, accounting for their correlations as well. Once those exposures are balanced, leverage can be applied to scale the portfolio toward a targeted level of risk and return.
Of course, risk parity doesn't guarantee equal performance across economic environments. Asset correlations can change, volatility estimates can prove inaccurate, and leverage magnifies losses as well as gains. The inflationary selloff of 2022, when stocks and nominal bonds declined together, illustrates why even diversified multi-asset strategies can encounter difficult periods.
Still, I think ALLW makes an interesting global macro sleeve for our hypothetical hedge fund portfolio. It provides systematic exposure to several major asset classes, incorporates an institutional-style risk allocation framework and offers a way to pursue diversified returns without having to make discretionary macroeconomic forecasts ourselves.
iMGP DBi Managed Futures Strategy ETF (DBMF)
The third and final sleeve in our hypothetical hedge fund ETF portfolio focuses more explicitly on risk management and diversification. For this allocation, I'm going with the iMGP DBi Managed Futures Strategy ETF (DBMF), one of the largest funds in its category, with approximately $5.6 billion in assets under management. Launched in May 2019, it currently charges a 0.85% expense ratio.
To understand what DBMF does, we first need to understand managed futures. These are strategies that use futures contracts to take long and short positions across asset classes such as equities, fixed income, currencies and commodities. Many employ systematic trend-following models, attempting to identify and capitalize on sustained price movements in either direction.
You might also encounter these strategies under the term commodity trading advisors (CTAs). Despite the name, CTAs aren't limited to commodities. Many trade a broad range of futures, using quantitative signals to determine which markets to buy, which to short and how much exposure to maintain.
DBMF takes a particularly interesting approach to implementing this strategy. Rather than attempting to develop its own independent trend-following signals, it uses a proprietary quantitative model to reverse-engineer the risk and return drivers of the SG CTA Index.
That benchmark tracks a selection of large commodity trading advisors employing systematic managed futures strategies. Crucially, DBMF seeks to replicate the index's underlying exposures on a pre-fee basis, allowing it to capture similar sources of return without incurring the full fee burden associated with investing directly in those underlying managers.
The historical results have been encouraging. Based on the latest figures, DBMF has outperformed the SG CTA Index across several trailing periods. These figures suggest that DBMF has been successful in delivering on its replication objective while generating meaningful excess returns relative to the benchmark. Its reported alpha against the SG CTA Index stands at 3.11%.
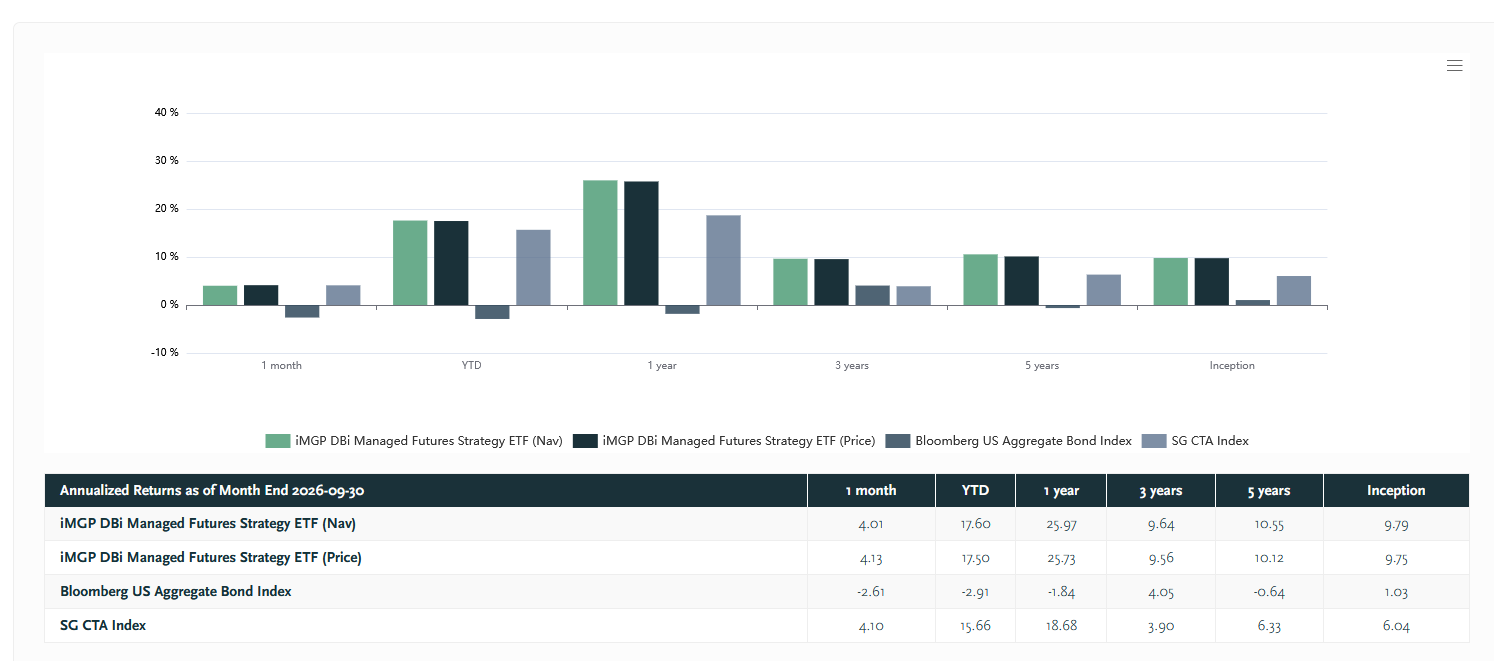
Source: iM Global Partners
Of course, the real attraction of managed futures goes beyond absolute returns. Their potential value in a diversified portfolio comes from their ability to profit from sustained trends that may emerge during periods of market stress, including falling equity markets, rising interest rates, inflationary pressures or significant currency movements.
DBMF has demonstrated this diversification potential with a reported beta of negative 0.06 relative to the S&P 500. In practical terms, that suggests its historical returns have exhibited very little sensitivity to movements in the U.S. stock market, making it a potentially useful complement to an equity allocation.

Source: iM Global Partners
That doesn't mean managed futures will always make money when stocks decline. Trend-following strategies can struggle when markets reverse direction abruptly or move sideways without establishing persistent trends. Their correlations with equities can also change over time.