VictoryShares Free Cash Flow ETF (VFLO) Review
Last Updated:

Free cash flow is back on investors' minds, and largely for the wrong reasons. The latest quarterly earnings reports from Alphabet and Amazon offered a reminder of just how expensive the artificial intelligence (AI) infrastructure boom is becoming. Both companies saw their shares sell off sharply as investors digested the scale of their capital expenditures and the resulting pressure on free cash flow.
Alphabet reported $42.3 billion in operating cash flow for the third quarter of 2026, but spent $51.4 billion on capital expenditures, implying approximately $9.1 billion in negative quarterly free cash flow. Amazon, meanwhile, reported negative free cash flow of $42.4 billion over the trailing 12 months, compared with positive $14.8 billion a year earlier.
The nature of these businesses is changing. For years, investors prized the technology giants for their high margins, strong cash generation and ability to scale without proportionate increases in capital spending. Now, the hyperscalers are committing enormous sums to data centres and chips. Whether those investments eventually generate attractive returns remains an open question.
Even amid the enthusiasm surrounding AI, investors still appear to care about free cash flow. At its core, equity valuation involves estimating a company's future cash flows, projecting how they might grow and discounting them back to the present using an appropriate required rate of return. The question is whether the resulting estimate of intrinsic value justifies the price being paid today.
That brings us to exchange-traded funds (ETFs). Several funds now use free cash flow as a central component of their stock selection methodology, but one of the most interesting, in my view, is the VictoryShares Free Cash Flow ETF (VFLO).
Although it isn't the largest ETF in this category, VFLO has grown into a substantial fund in its own right, with approximately $12.5 billion in assets under management. Much of that growth has coincided with impressive outperformance since its inception, which we'll examine shortly.
There's plenty to like about VFLO, particularly its emphasis on cash-generative companies and the discipline imposed by its selection methodology. But strong historical returns also raise questions about whether the factors responsible for its success can persist.
As usual, I'll take a balanced approach, examining VFLO's strategy, its advantages and drawbacks, and my forward-looking assessment of whether this ETF still deserves a place in investors' portfolios.
What I Like About VFLO
When investing through a passive free cash flow based ETF, you're effectively outsourcing stock selection to an index methodology. How that benchmark measures free cash flow can make or break the strategy. One issue I have with some of VFLO's competitors is their reliance on trailing free cash flow yields.
Historical cash generation certainly matters, but it can be misleading. A company might appear exceptionally cheap because its free cash flow was temporarily elevated by a reduction in capital expenditures or a favorable working capital adjustment. Conversely, a business investing heavily today might look expensive despite having promising future cash generation.
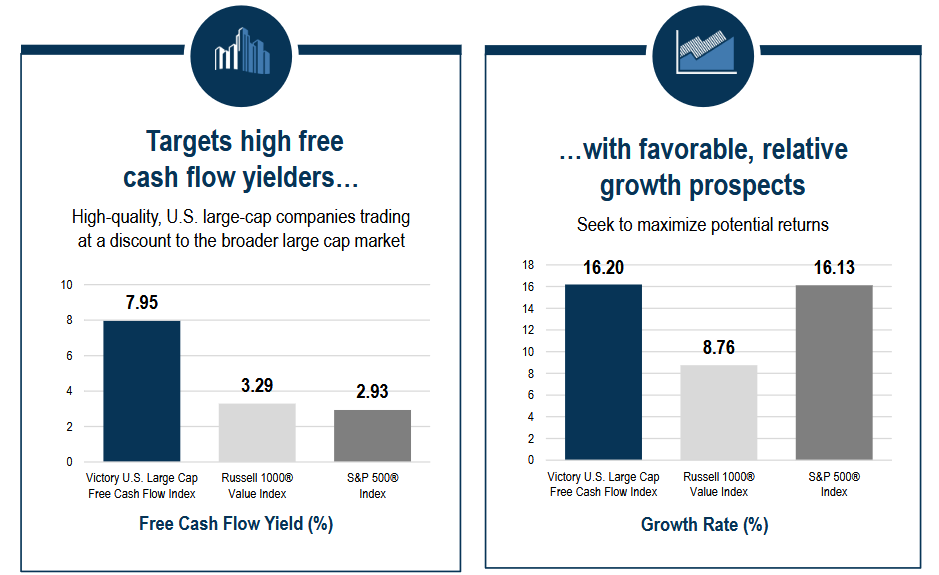
Forward-looking analyst estimates are imperfect, sometimes substantially so, but I think they deserve a place in the process. That's something VFLO does particularly well. The ETF tracks the proprietary Victory U.S. Large Cap Free Cash Flow Index, which incorporates both historical and expected free cash flow, along with a composite growth screen.
Specifically, its free cash flow yield calculation averages trailing 12-month free cash flow and estimated next 12-month free cash flow, then divides that figure by enterprise value.
Enterprise value is an important distinction. Whereas market capitalization measures the value of a company's equity alone, enterprise value also accounts for debt and cash. This provides a more comprehensive measure of what an investor would effectively pay for the underlying business, particularly when comparing companies with different capital structures.
I also appreciate that VFLO doesn't stop at free cash flow yield. Its methodology incorporates a growth filter based on three additional metrics: sales trends, earnings before interest, taxes, depreciation and amortization (EBITDA) trends, and long-term earnings per share (EPS) growth estimates.
The sales trend metric examines the slope of a company's revenue trajectory using five years of historical sales and two years of forward estimates, normalized by the average sales over that period. The EBITDA trend applies the same approach to operating profitability, while the long-term EPS growth component uses consensus estimates of annual earnings growth over the next three to five years.
A high free cash flow yield can sometimes indicate a deteriorating business rather than an undervalued one. A company facing declining revenue, shrinking margins or weakening earnings prospects might look cheap based on its current cash generation, even as its underlying fundamentals worsen. By incorporating growth expectations, VFLO attempts to sift out value traps.
Source: Victory Capital
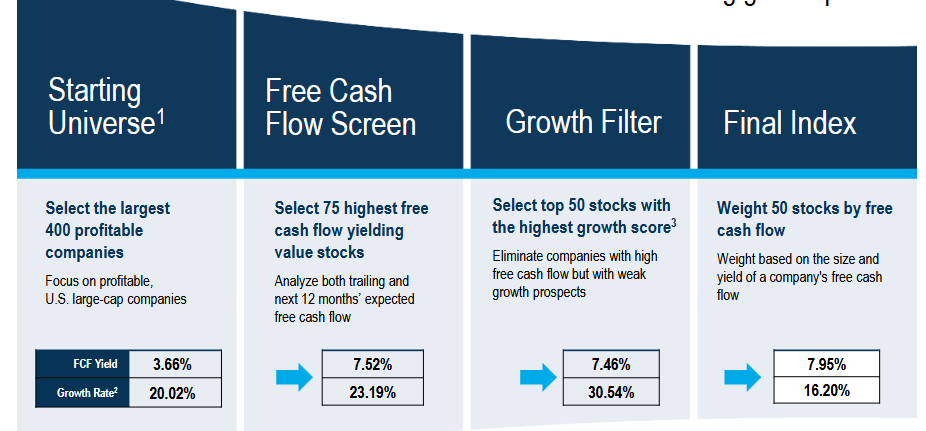
Now that we've covered the underlying metrics, here's how they come together. The index starts with a universe of 400 large-cap U.S. companies and selects the 75 stocks with the highest free cash flow yields. From that shortlist, it narrows the portfolio to the 50 companies with the strongest growth scores, using the sales, EBITDA and EPS metrics discussed above.
The final constituents are then weighted according to their free cash flow, giving greater influence for companies generating more cash. The index is rebalanced and reconstituted quarterly, allowing it to regularly reassess valuations, growth prospects and portfolio weights as fundamentals change.
Source: Victory Capital
The resulting portfolio is quite different from a conventional market-cap-weighted U.S. large-cap ETF. However, the historical performance suggests that this methodology has worked exceptionally well.
Source: Testfolio
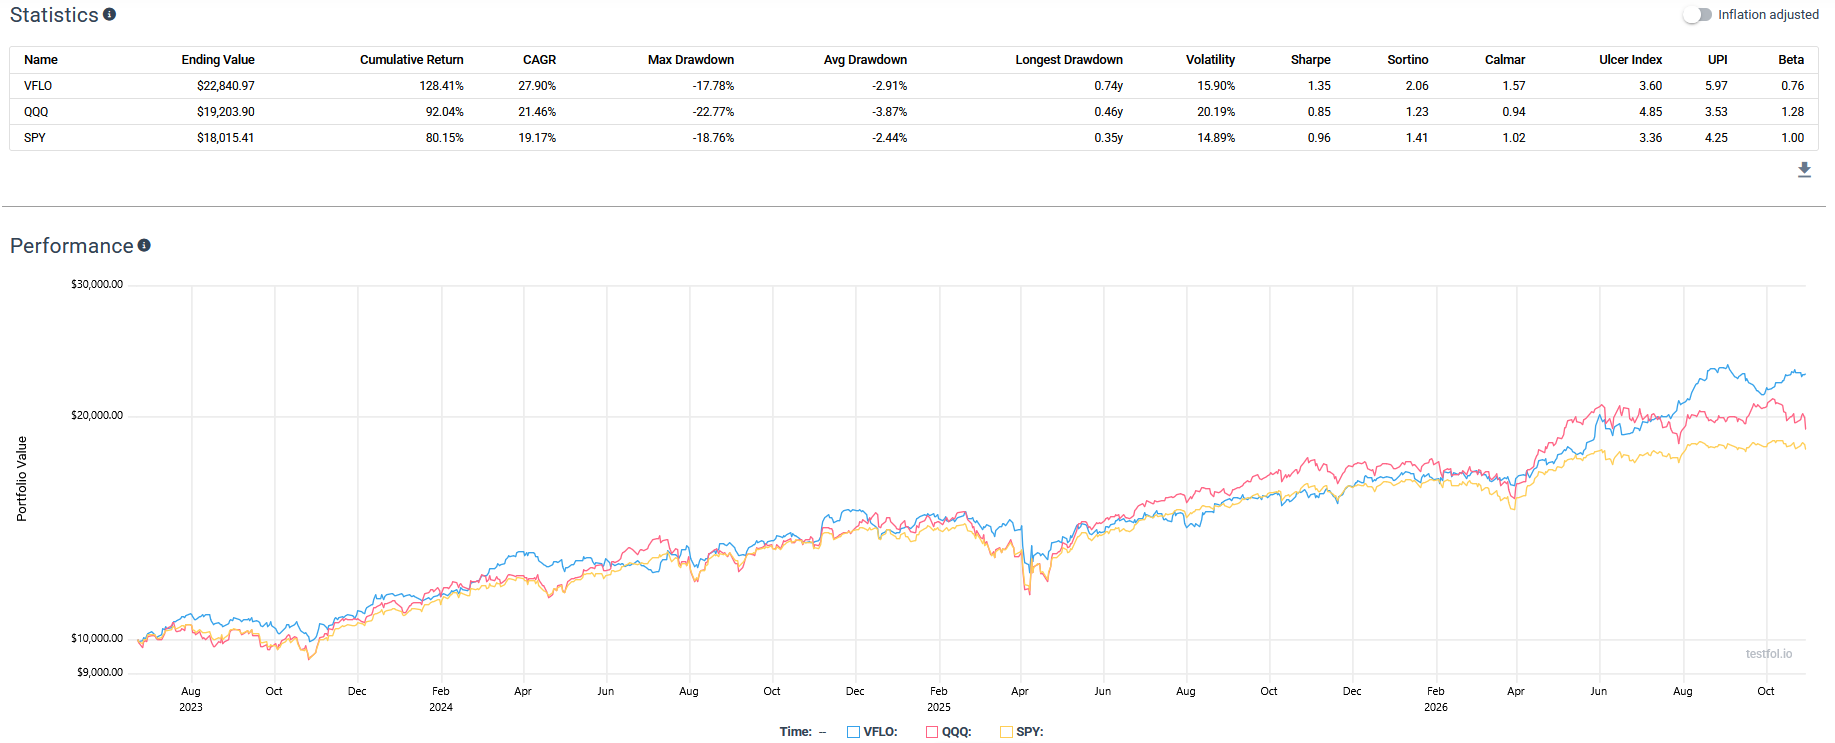
Over this period, VFLO generated an annualized return of 27.90%, compared with 19.17% for the S&P 500 benchmark ETF and 21.46% for the Nasdaq-100 ETF. In cumulative terms, that translated into a 128.41% gain for VFLO, versus 80.15% for SPY and 92.04% for QQQ.
Even more impressive is the difference in risk-adjusted performance. VFLO achieved a Sharpe ratio of 1.35, compared with 0.96 for SPY and 0.85 for QQQ. The Sharpe ratio measures excess return per unit of volatility, meaning VFLO delivered more return relative to the risk experienced over this period.
In that respect, VFLO's methodology has delivered. It substantially outperformed two difficult-to-beat benchmarks during a market environment that was favorable for U.S. large-cap growth stocks. Of course, three years of outperformance doesn't establish that a strategy will continue working indefinitely.
What I Dislike About VFLO
I'll admit that I'm nitpicking here. VFLO has delivered impressive results, and I think its underlying methodology is sound. My reservations also go beyond the usual disclaimer that past performance doesn't guarantee future returns.
In fact, I suspect that any prolonged underperformance relative to SPY or QQQ would have less to do with VFLO's methodology, which is largely predetermined, and more to do with the prevailing economic environment. Different investment factors tend to outperform at different points in the market cycle, and free cash flow investing is no exception.
For example, VFLO could struggle during a speculative growth rally when investors prioritize future revenue potential over current cash generation. Companies investing aggressively in expansion may command increasingly generous valuations despite producing little or even negative free cash flow.
There's also the possibility of a sustained rally in a handful of mega-cap technology stocks, which market-cap weighted benchmarks can capture but VFLO can’t. As seen below, VFLO did underperform QQQ in 2024 and 2025, albeit not by that much.

Source: Testfolio
Those are risks inherent to the investment approach rather than shortcomings unique to VFLO. There are, however, two aspects of the ETF that I find less than optimal.
The first is its 0.39% expense ratio. To be fair, that's competitive within the free cash flow ETF category. The considerably larger Pacer US Cash Cows 100 ETF (COWZ) charges 0.49%. Within the context of specialized free cash flow ETFs, however, I don't consider 0.39% unreasonable.
But we also live in an era of relentless fee compression, and investors have become understandably cost-conscious. When something like the Vanguard S&P 500 ETF (VOO) charges just 0.03%, there's a reasonable chance that many investors will simply opt for the cheaper broad-market exposure.
That fee difference also compounds over time. VFLO must generate an additional 0.36% of annual gross performance merely to overcome its fee disadvantage relative to VOO. Its historical outperformance has more than compensated for that hurdle, but there's no guarantee the same will hold going forward.
My second concern is the index's diversification rules. Individual holdings are capped at 4% of the index, while sector weights are subject to a 45% maximum and cannot exceed their corresponding weights in the starting universe by more than 20 percentage points.
I think the individual holding limit makes sense. It prevents a handful of stocks from dominating the portfolio and reduces company-specific risk, at the cost of not letting winners run as much. The sector constraints, however, strike me as somewhat generous, potentially allowing substantial concentration in industries that happen to screen particularly well at a given time.
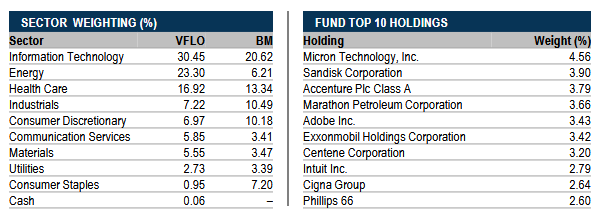
As of September 30, 2026, VFLO had a 30.45% allocation to information technology, broadly comparable to the S&P 500. The more distinctive exposure was energy, which accounted for 23.3% of the portfolio. To the fund's credit, its methodology identified attractive free cash flow opportunities among energy companies ahead of the sector's recent rally.
Source: Victory Capital
Higher energy prices associated with geopolitical conflict can substantially improve cash generation for producers, particularly those maintaining disciplined capital spending. Still, a nearly one-quarter allocation to energy introduces meaningful sensitivity to commodity prices. If oil and natural gas prices retreat, the same companies that currently look attractive on free cash flow metrics could fall.
One mitigating factor is the index's quarterly rebalancing and reconstitution schedule. Because the methodology reassesses companies relatively frequently, VFLO can adjust its holdings as valuations, cash flow expectations and growth prospects change. That provides a mechanism for reducing exposure to sectors whose fundamentals have weakened and identifying new opportunities elsewhere.
That's ultimately the trade-off with any systematic factor strategy: the rules provide discipline and consistency, but they cannot guarantee that the portfolio will be positioned ahead of every rotation.
VFLO: My Verdict
No ETF is perfect, but as far as I'm concerned, VFLO comes pretty close. This has become one of Victory Capital's flagship products, and rightfully so. I give it a 9/10.
What impresses me most is the sophistication of its index methodology. By combining trailing and forward free cash flow estimates with revenue, EBITDA and earnings growth screens, VFLO offers a more comprehensive approach than simply ranking companies by historical free cash flow yield. Its quarterly reconstitution also allows the portfolio to adapt as fundamentals and valuations change.
The results speak for themselves. Since inception, VFLO has substantially outperformed both SPY and QQQ, with considerably better risk-adjusted returns. That's an impressive achievement given how difficult those benchmarks have been to beat over the same period.
My criticisms are relatively minor. The 0.39% expense ratio creates a meaningful long-term hurdle compared with conventional index ETFs, although it remains competitive within its category. I'm also somewhat uncomfortable with how much sector concentration the methodology permits, particularly given the fund's sizable energy allocation. These are trade-offs I'm willing to acknowledge and monitor rather than reasons to dismiss the strategy.
Looking ahead, one development I'll be particularly interested in watching is whether VFLO eventually rotates back toward the Magnificent Seven technology stocks. If the hyperscalers' enormous capital expenditure programs begin translating into stronger free cash flow, the index's combination of forward-looking estimates and growth screening could make those companies attractive again. I'd be especially impressed if the methodology identifies that inflection point before the broader market fully prices it in.
My preference remains with my existing investment approach, and strong historical performance alone isn't enough to persuade me to change course. Nevertheless, VFLO will remain on my watch list. For now, I consider it the poster child for free cash flow ETFs, and that's where it will stay until a competitor gives me a compelling reason to reconsider.